PROTECTED SOURCE SCRIPT
Cập nhật Directional filter
The idea is to show simply through colors "stronger or weaker" the relevance of candles in the current direction of the asset.
the indicator was made to be used in the graphics of 5m and 15m. based on the SMA20 already indicated previously and with a SMA20 of the graph of 60m.
candles will have their colors modified according to their relevance in the current trend, "A" through "D", where "A" is the strongest and "D" is the weakest.
Conditions:
Buy candle A: price closes above SMA20 (5m or 15m) and above SM20 of 60m.
Buy candle B: price closes above the SMA20 (5m or 15m) and below the SMA20 of 60m.
Buy candle C: Price closes below the SMA20 (5m or 15m) and above the SMA20 60m.
Buy candle D: price closes below the SMA20 (5m or 15m) and below the SMA20 of 60m.
Sell candle A: price closes below the SMA20 (5m or 15m) and below the SMA20 of 60m.
Sell candle B: price closes below the SMA20 (5m or 15m) and above the SMA20 of 60m.
Sell candle C: price closes above the SMA20 (5m or 15m) and below the SMA20 of 60m.
Sell candle D: price closes above the SMA20 (5m or 15m) and above the SMA20 of 60m.
Note 1: SMA8 and SMA200 are also inserted (but they do not interfere with the indicator)
Note 2:
I will leave an image with the colors that represent the relevance of each candle.
https://imageshack.com/a/img921/1808/uv3Wo8.png
Phát hành các Ghi chú
the update is available to change the color of the SMA 20 (5min or 15min) according to the direction and the asset is.Green = SMA20 UP
Red = SMA20 DOWN
White = NEUTRAL
Phát hành các Ghi chú
Version 3.0 did the exchange of SMA 8 by EMA 9when the EMA 9 is up your color will be blue, when it is down your color will be orange.
There was no change in the colors of the candles
Phát hành các Ghi chú
Replacement of SMA 20 by EMA 21.Phát hành các Ghi chú
All SMA 20 were replaced by EMA 21Phát hành các Ghi chú
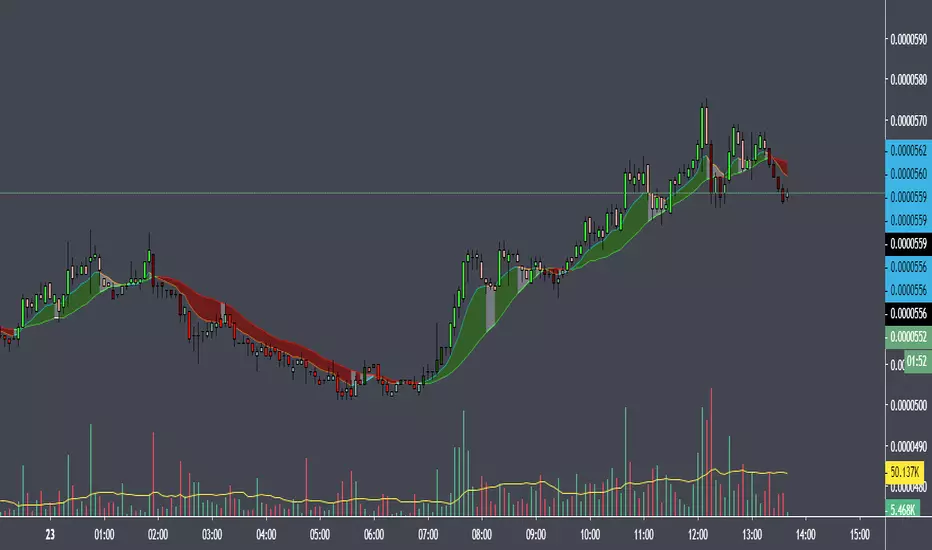
Update to fill the zone between the EMAs selected according to the current price of the asset.price closed above EMAs = green fill
price closed below the EMAs = red fill
price closed between EMAs = white fill
Phát hành các Ghi chú
fill correctionPhát hành các Ghi chú
I found it more appropriate to exchange EMA 20 for SMA 21.Phát hành các Ghi chú
a small correction in the names of the settingsMã được bảo vệ
Tập lệnh này được đăng dưới dạng mã nguồn đóng. Tuy nhiên, bạn có thể sử dụng tự do và không giới hạn – tìm hiểu thêm tại đây.
Thông báo miễn trừ trách nhiệm
Thông tin và các ấn phẩm này không nhằm mục đích, và không cấu thành, lời khuyên hoặc khuyến nghị về tài chính, đầu tư, giao dịch hay các loại khác do TradingView cung cấp hoặc xác nhận. Đọc thêm tại Điều khoản Sử dụng.
Mã được bảo vệ
Tập lệnh này được đăng dưới dạng mã nguồn đóng. Tuy nhiên, bạn có thể sử dụng tự do và không giới hạn – tìm hiểu thêm tại đây.
Thông báo miễn trừ trách nhiệm
Thông tin và các ấn phẩm này không nhằm mục đích, và không cấu thành, lời khuyên hoặc khuyến nghị về tài chính, đầu tư, giao dịch hay các loại khác do TradingView cung cấp hoặc xác nhận. Đọc thêm tại Điều khoản Sử dụng.