OPEN-SOURCE SCRIPT
Cập nhật Cap's Dual Auto Fib Retracement
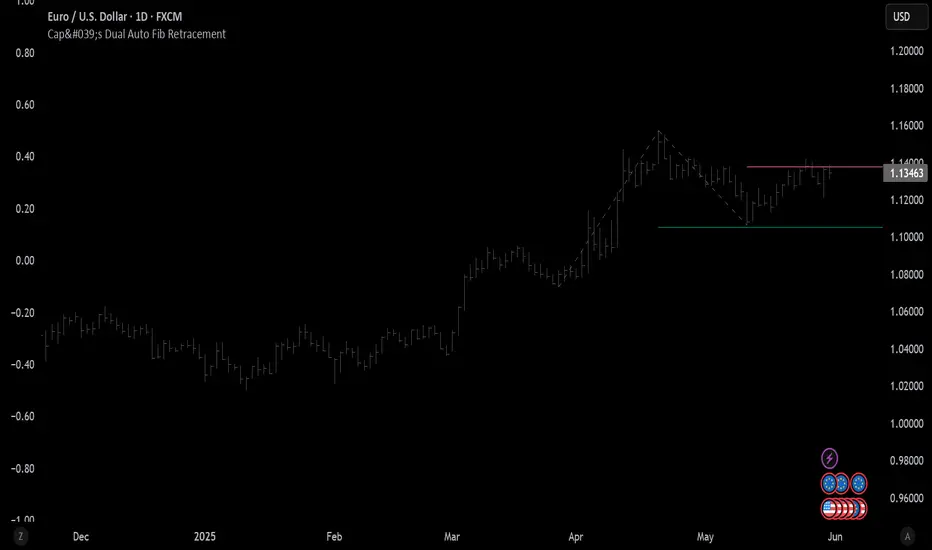
This will draw both a bullish retracement and a bearish retracement. It's defaulted to just show the 0.618 level as I feel like this is the "make or break" level.
- A close below the bullish 0.618 retracement would be considered very bearish.
- A close above the bearish 0.618 would be considered very bullish.
(You can still configure whichever levels you want, however.)
This script was removed by TradingView last time it was published. I couldn't find another script that would provide both bearish/bullish retracements, so I'm assuming this is "original" enough. Maybe it was removed because the description wasn't long enough, so...
Detailed Description:
This indicator automatically plots Fibonacci retracement levels based on zigzag pivot points for both bullish (low-to-high) and bearish (high-to-low) price movements. It identifies key pivot points using a customizable deviation multiplier and depth setting, then draws Fibonacci levels (0, 0.236, 0.382, 0.5, 0.618, 0.786, 1) with user-defined visibility and colors for each level.
Features:
Deviation: Adjusts sensitivity for detecting pivots (default: 2).
Depth: Sets minimum bars for pivot calculation (default: 10).
Extend Lines: Option to extend lines left, right, or both.
Show Prices/Levels: Toggle price and level labels, with options for value or percentage display.
Labels Position: Choose left or right label placement.
Background Transparency: Customize fill transparency between levels.
Alerts: Triggers when price crosses any Fibonacci level.
Usage: Apply to any chart to visualize potential support/resistance zones. Adjust settings to suit your trading style. Requires sufficient data; use lower timeframes or reduce depth if pivots are not detected.
Note: This is a technical analysis tool and does not provide trading signals or financial advice. Always conduct your own research.
Phát hành các Ghi chú
updating chart picture with other indicators removed to make the mods happy.Phát hành các Ghi chú
updating with clean chart image (all other drawings/text/indicators) removed.Mã nguồn mở
Theo đúng tinh thần TradingView, tác giả của tập lệnh này đã công bố nó dưới dạng mã nguồn mở, để các nhà giao dịch có thể xem xét và xác minh chức năng. Chúc mừng tác giả! Mặc dù bạn có thể sử dụng miễn phí, hãy nhớ rằng việc công bố lại mã phải tuân theo Nội quy.
Thông báo miễn trừ trách nhiệm
Thông tin và các ấn phẩm này không nhằm mục đích, và không cấu thành, lời khuyên hoặc khuyến nghị về tài chính, đầu tư, giao dịch hay các loại khác do TradingView cung cấp hoặc xác nhận. Đọc thêm tại Điều khoản Sử dụng.
Mã nguồn mở
Theo đúng tinh thần TradingView, tác giả của tập lệnh này đã công bố nó dưới dạng mã nguồn mở, để các nhà giao dịch có thể xem xét và xác minh chức năng. Chúc mừng tác giả! Mặc dù bạn có thể sử dụng miễn phí, hãy nhớ rằng việc công bố lại mã phải tuân theo Nội quy.
Thông báo miễn trừ trách nhiệm
Thông tin và các ấn phẩm này không nhằm mục đích, và không cấu thành, lời khuyên hoặc khuyến nghị về tài chính, đầu tư, giao dịch hay các loại khác do TradingView cung cấp hoặc xác nhận. Đọc thêm tại Điều khoản Sử dụng.