PROTECTED SOURCE SCRIPT
Cập nhật Bitcoin SOPR Heatmap
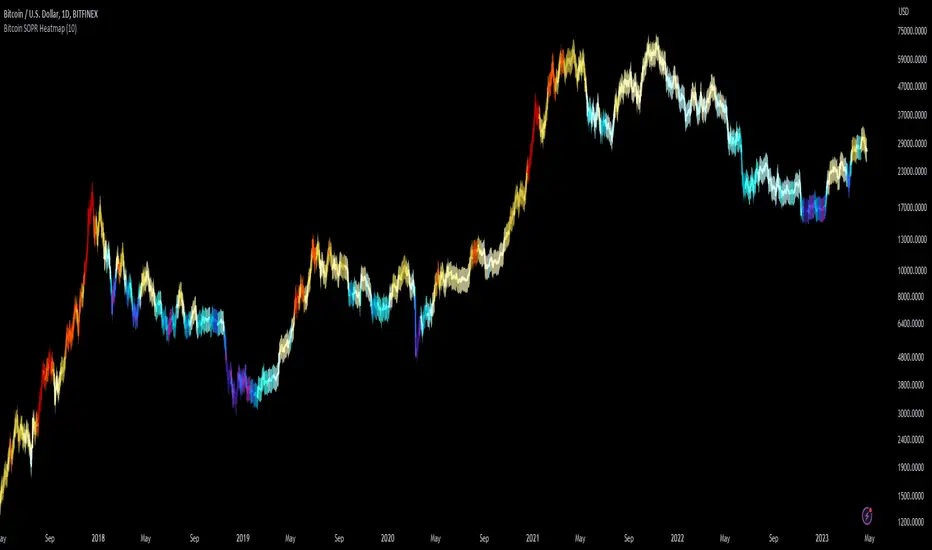
SOPR (spent output profit ratio) is a metric, provided by Glassnode to measure if most BTC are moved in profit or in loss. The higher SOPR is, the more profits are realized (theoretically) and vice versa.
This indicator shows SOPR visually as a heatmap directly on the Bitcoin chart.
Cold temperatures (blue, purple) show bear markets. Bear market peaks should be visible in dark purple.
Hot temperatues (yellow, red) show bull markets. Hype phases should be visible in red.
I recommend to hide chart when using the indicator. Otherwise you can also enlarge the heatmap in the settings.
The indicator works best on BTCUSD standard charts on daily timeframe. Otherwise you will see an error message.
Phát hành các Ghi chú
- Code error fixed
Mã được bảo vệ
Tập lệnh này được đăng dưới dạng mã nguồn đóng. Tuy nhiên, bạn có thể sử dụng tự do và không giới hạn – tìm hiểu thêm tại đây.
We build Bitcoin and crypto algorithms with the intention to outperform.
Check out our website to see more of our work.
Check out our website to see more of our work.
Thông báo miễn trừ trách nhiệm
Thông tin và các ấn phẩm này không nhằm mục đích, và không cấu thành, lời khuyên hoặc khuyến nghị về tài chính, đầu tư, giao dịch hay các loại khác do TradingView cung cấp hoặc xác nhận. Đọc thêm tại Điều khoản Sử dụng.