PROTECTED SOURCE SCRIPT
Cập nhật Super Smart v1
Here’s a full breakdown of its **features and options** grouped by function 👇
---
## 🧩 1. **User Inputs (Settings Menu)**
These are the configurable options visible in the TradingView indicator settings:
### **EMA Settings**
| Parameter | Default | Description |
| ------------- | ------- | ------------------------------------- |
| `emaShortLen` | 20 | Main fast EMA length |
| `emaLongLen` | 50 | Main slow EMA length |
| `emaExtraLen` | 100 | Extra (longer-term) EMA length |
| `smmaLen` | 14 | SMMA (Smoothed Moving Average) period |
### **Extra EMA Option**
| Parameter | Default | Description |
| ------------- | ------- | ----------------------------------------- |
| `useExtraEMA` | ✅ true | Enables additional EMA 9/21 cross signals |
### **RSI Settings**
| Parameter | Default | Description |
| ------------- | ------- | ---------------------------- |
| `rsiPeriod` | 14 | RSI period |
| `overbought` | 70 | RSI overbought threshold |
| `oversold` | 30 | RSI oversold threshold |
| `divLookback` | 5 | RSI divergence lookback bars |
### **Fibonacci Settings**
| Parameter | Default | Description |
| ----------------- | ------- | --------------------------------------------------------- |
| `fibLookbackBars` | 100 | Bars to look back for Fib high/low |
| `fibTolerance` | 0.01 | How close price must be to a Fib level to count as “near” |
### **Dashboard Settings**
| Parameter | Default | Options |
| ----------------- | ----------- | ------------------------------------------------------ |
| `dashboardPosOpt` | "Top Right" | “Top Left”, “Top Right”, “Bottom Left”, “Bottom Right” |
---
## 📊 2. **Indicators Calculated**
The script calculates and plots several core technical indicators:
* **EMA 20**, **EMA 50**, **EMA 100**
* **SMMA 14**
* **VWAP**
* *(Optional)* **EMA 9** and **EMA 21** (for secondary cross signals)
* **RSI (14)** with thresholds at 30, 50, and 70
* **Fibonacci retracement levels** (0.236 → 0.886 range)
* **RSI Divergences** (bullish and bearish)
* **External SMA(10) crossover signals**
---
## ⚙️ 3. **Trading Conditions**
These generate the **buy/sell signals**:
| Signal | Logic Summary |
| -------------------- | ------------------------------------------------------------------------------------------------------------ |
| **Super Smart Buy** | Bullish trend (EMA20 > EMA50, price > VWAP), price above SMMA, RSI or EMA cross or SMA cross, near Fib level |
| **Super Smart Sell** | Bearish trend (EMA20 < EMA50, price < VWAP), price below SMMA, RSI or EMA cross or SMA cross, near Fib level |
| **BOOST Buy** | Super Smart Buy + RSI momentum > 50 or bullish RSI divergence |
| **BOOST Sell** | Super Smart Sell + RSI momentum < 50 or bearish RSI divergence |
Each condition has its own **plotshape** (visual icon on chart).
---
## 💪 4. **Signal Strength Calculation**
The indicator computes a **“Signal Strength”** percentage (0–100%) based on eight contributing factors:
1. Trend direction (EMA20 vs EMA50, and VWAP relation)
2. EMA9/21 cross
3. SMMA position
4. RSI crossovers
5. RSI momentum
6. Divergences
7. Fibonacci proximity
The result is shown on the dashboard with a **color gradient**:
* **Green** → Strong signal (≥71%)
* **Orange** → Medium strength (31–70%)
* **Red** → Weak (<30%)
---
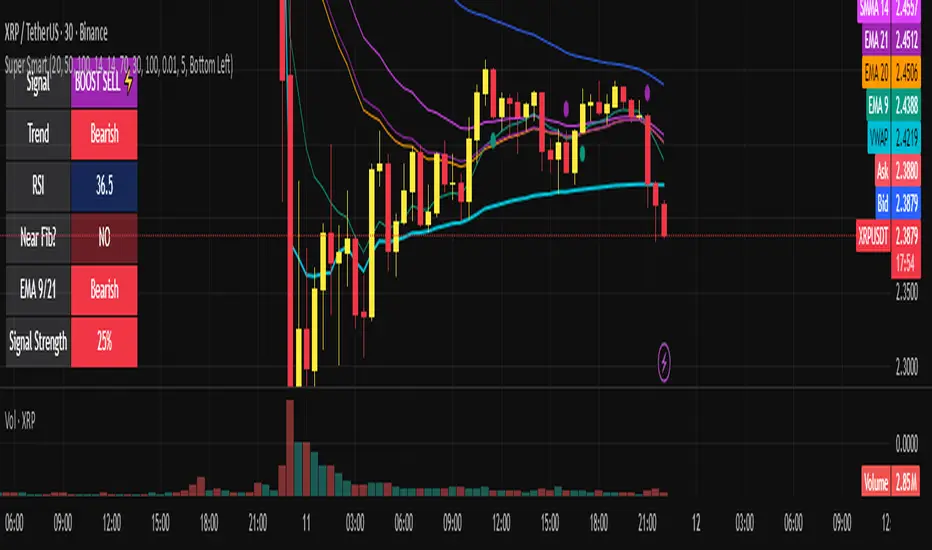
## 🧭 5. **Dashboard Display**
The built-in dashboard shows:
| Row | Label | Displayed Info |
| --- | ------------------- | --------------------------------------------------------------------------- |
| 1 | **Signal** | “SMART BUY ✅”, “BOOST BUY 🚀”, “SMART SELL ⛔”, “BOOST SELL ⚡”, or “NEUTRAL” |
| 2 | **Trend** | “Bullish”, “Bearish”, or “Sideways” |
| 3 | **RSI** | Current RSI value |
| 4 | **Near Fib?** | YES/NO |
| 5 | **EMA 9/21** | Bullish / Bearish / Disabled |
| 6 | **Signal Strength** | % (with color-coded background) |
Dashboard position is user-selectable (corners of the chart).
---
## 🟢 6. **Visual Plot Elements**
* EMA lines (20/50/100)
* SMMA line
* VWAP line
* Optional EMA9/21 lines
* Buy/Sell arrows:
* 🔼 **Green** = Smart Buy
* 🔽 **Red** = Smart Sell
* 🚀 **Aqua** = Boost Buy
* ⚡ **Purple** = Boost Sell
* Small circles for EMA9/21 crosses
---
## 🧠 7. **Summary of Features**
✅ Multi-timeframe EMA strategy
✅ RSI + Divergence detection
✅ Fibonacci confluence detection
✅ VWAP-based trend filtering
✅ Dynamic signal strength meter
✅ “Boost” (enhanced) signal logic
✅ Visual dashboard (movable)
✅ Extra EMA 9/21 system toggle
---
┌────────────────────────┐
│ MARKET DATA (price) │
└──────────┬─────────────┘
│
▼
┌──────────────────────────────────────────────┐
│ CORE INDICATORS │
├──────────────────────────────────────────────┤
│ EMA20 / EMA50 / EMA100 / EMA9 / EMA21 │
│ SMMA14 │
│ VWAP │
│ RSI (14) │
│ Fibonacci Levels (Lookback 100 bars) │
│ RSI Divergences │
│ SMA10 (for external crossover) │
└──────────────────────────────────────────────┘
│
▼
┌──────────────────────────────────────────────┐
│ TREND FILTERS │
├──────────────────────────────────────────────┤
│ Bullish Trend: EMA20 > EMA50 AND close > VWAP│
│ Bearish Trend: EMA20 < EMA50 AND close < VWAP│
│ Above SMMA14 → Bullish bias │
│ Below SMMA14 → Bearish bias │
└──────────────────────────────────────────────┘
│
▼
┌──────────────────────────────────────────────┐
│ ENTRY TRIGGERS │
├──────────────────────────────────────────────┤
│ RSI Crosses: │
│ - Overbought (Sell) │
│ - Oversold (Buy) │
│ - Midline 50 momentum crosses │
│ EMA Crosses: │
│ - EMA20/50 Bull or Bear │
│ - (Optional) EMA9/21 Bull or Bear │
│ External SMA10 crossover │
│ Fibonacci proximity (near key retrace level) │
│ RSI Divergence (Bullish or Bearish) │
└──────────────────────────────────────────────┘
│
▼
┌──────────────────────────────────────────────┐
│ SUPER SMART BASE SIGNALS │
├──────────────────────────────────────────────┤
│ SMART BUY = BullTrend + AboveSMMA + │
│ (RSI Buy OR EMA Cross OR SMA X) │
│ + Near Fibonacci Level │
│ │
│ SMART SELL = BearTrend + BelowSMMA + │
│ (RSI Sell OR EMA Cross OR SMA X)│
│ + Near Fibonacci Level │
└──────────────────────────────────────────────┘
│
▼
┌──────────────────────────────────────────────┐
│ BOOST CONFIRMATIONS │
├──────────────────────────────────────────────┤
│ BOOST BUY = SMART BUY + (RSI>50 OR BullDiv) │
│ BOOST SELL = SMART SELL + (RSI<50 OR BearDiv)│
└──────────────────────────────────────────────┘
│
▼
┌──────────────────────────────────────────────┐
│ SIGNAL STRENGTH CALCULATION (0–100%) │
├──────────────────────────────────────────────┤
│ Points added for: │
│ - Trend alignment │
│ - EMA crosses │
│ - SMMA position │
│ - RSI momentum │
│ - Divergence │
│ - Near Fibonacci │
│ Output = (Total / Max 8) × 100% │
└──────────────────────────────────────────────┘
│
▼
┌──────────────────────────────────────────────┐
│ DASHBOARD │
├──────────────────────────────────────────────┤
│ Displays: │
│ - Signal Type (Buy/Sell/Boost/Neutral) │
│ - Trend Direction │
│ - RSI Value │
│ - Near Fib (Yes/No) │
│ - EMA 9/21 Status │
│ - Signal Strength (%) + Color Gradient │
│ Position: user-selectable (corner) │
└──────────────────────────────────────────────┘
---
## 🧩 1. **User Inputs (Settings Menu)**
These are the configurable options visible in the TradingView indicator settings:
### **EMA Settings**
| Parameter | Default | Description |
| ------------- | ------- | ------------------------------------- |
| `emaShortLen` | 20 | Main fast EMA length |
| `emaLongLen` | 50 | Main slow EMA length |
| `emaExtraLen` | 100 | Extra (longer-term) EMA length |
| `smmaLen` | 14 | SMMA (Smoothed Moving Average) period |
### **Extra EMA Option**
| Parameter | Default | Description |
| ------------- | ------- | ----------------------------------------- |
| `useExtraEMA` | ✅ true | Enables additional EMA 9/21 cross signals |
### **RSI Settings**
| Parameter | Default | Description |
| ------------- | ------- | ---------------------------- |
| `rsiPeriod` | 14 | RSI period |
| `overbought` | 70 | RSI overbought threshold |
| `oversold` | 30 | RSI oversold threshold |
| `divLookback` | 5 | RSI divergence lookback bars |
### **Fibonacci Settings**
| Parameter | Default | Description |
| ----------------- | ------- | --------------------------------------------------------- |
| `fibLookbackBars` | 100 | Bars to look back for Fib high/low |
| `fibTolerance` | 0.01 | How close price must be to a Fib level to count as “near” |
### **Dashboard Settings**
| Parameter | Default | Options |
| ----------------- | ----------- | ------------------------------------------------------ |
| `dashboardPosOpt` | "Top Right" | “Top Left”, “Top Right”, “Bottom Left”, “Bottom Right” |
---
## 📊 2. **Indicators Calculated**
The script calculates and plots several core technical indicators:
* **EMA 20**, **EMA 50**, **EMA 100**
* **SMMA 14**
* **VWAP**
* *(Optional)* **EMA 9** and **EMA 21** (for secondary cross signals)
* **RSI (14)** with thresholds at 30, 50, and 70
* **Fibonacci retracement levels** (0.236 → 0.886 range)
* **RSI Divergences** (bullish and bearish)
* **External SMA(10) crossover signals**
---
## ⚙️ 3. **Trading Conditions**
These generate the **buy/sell signals**:
| Signal | Logic Summary |
| -------------------- | ------------------------------------------------------------------------------------------------------------ |
| **Super Smart Buy** | Bullish trend (EMA20 > EMA50, price > VWAP), price above SMMA, RSI or EMA cross or SMA cross, near Fib level |
| **Super Smart Sell** | Bearish trend (EMA20 < EMA50, price < VWAP), price below SMMA, RSI or EMA cross or SMA cross, near Fib level |
| **BOOST Buy** | Super Smart Buy + RSI momentum > 50 or bullish RSI divergence |
| **BOOST Sell** | Super Smart Sell + RSI momentum < 50 or bearish RSI divergence |
Each condition has its own **plotshape** (visual icon on chart).
---
## 💪 4. **Signal Strength Calculation**
The indicator computes a **“Signal Strength”** percentage (0–100%) based on eight contributing factors:
1. Trend direction (EMA20 vs EMA50, and VWAP relation)
2. EMA9/21 cross
3. SMMA position
4. RSI crossovers
5. RSI momentum
6. Divergences
7. Fibonacci proximity
The result is shown on the dashboard with a **color gradient**:
* **Green** → Strong signal (≥71%)
* **Orange** → Medium strength (31–70%)
* **Red** → Weak (<30%)
---
## 🧭 5. **Dashboard Display**
The built-in dashboard shows:
| Row | Label | Displayed Info |
| --- | ------------------- | --------------------------------------------------------------------------- |
| 1 | **Signal** | “SMART BUY ✅”, “BOOST BUY 🚀”, “SMART SELL ⛔”, “BOOST SELL ⚡”, or “NEUTRAL” |
| 2 | **Trend** | “Bullish”, “Bearish”, or “Sideways” |
| 3 | **RSI** | Current RSI value |
| 4 | **Near Fib?** | YES/NO |
| 5 | **EMA 9/21** | Bullish / Bearish / Disabled |
| 6 | **Signal Strength** | % (with color-coded background) |
Dashboard position is user-selectable (corners of the chart).
---
## 🟢 6. **Visual Plot Elements**
* EMA lines (20/50/100)
* SMMA line
* VWAP line
* Optional EMA9/21 lines
* Buy/Sell arrows:
* 🔼 **Green** = Smart Buy
* 🔽 **Red** = Smart Sell
* 🚀 **Aqua** = Boost Buy
* ⚡ **Purple** = Boost Sell
* Small circles for EMA9/21 crosses
---
## 🧠 7. **Summary of Features**
✅ Multi-timeframe EMA strategy
✅ RSI + Divergence detection
✅ Fibonacci confluence detection
✅ VWAP-based trend filtering
✅ Dynamic signal strength meter
✅ “Boost” (enhanced) signal logic
✅ Visual dashboard (movable)
✅ Extra EMA 9/21 system toggle
---
┌────────────────────────┐
│ MARKET DATA (price) │
└──────────┬─────────────┘
│
▼
┌──────────────────────────────────────────────┐
│ CORE INDICATORS │
├──────────────────────────────────────────────┤
│ EMA20 / EMA50 / EMA100 / EMA9 / EMA21 │
│ SMMA14 │
│ VWAP │
│ RSI (14) │
│ Fibonacci Levels (Lookback 100 bars) │
│ RSI Divergences │
│ SMA10 (for external crossover) │
└──────────────────────────────────────────────┘
│
▼
┌──────────────────────────────────────────────┐
│ TREND FILTERS │
├──────────────────────────────────────────────┤
│ Bullish Trend: EMA20 > EMA50 AND close > VWAP│
│ Bearish Trend: EMA20 < EMA50 AND close < VWAP│
│ Above SMMA14 → Bullish bias │
│ Below SMMA14 → Bearish bias │
└──────────────────────────────────────────────┘
│
▼
┌──────────────────────────────────────────────┐
│ ENTRY TRIGGERS │
├──────────────────────────────────────────────┤
│ RSI Crosses: │
│ - Overbought (Sell) │
│ - Oversold (Buy) │
│ - Midline 50 momentum crosses │
│ EMA Crosses: │
│ - EMA20/50 Bull or Bear │
│ - (Optional) EMA9/21 Bull or Bear │
│ External SMA10 crossover │
│ Fibonacci proximity (near key retrace level) │
│ RSI Divergence (Bullish or Bearish) │
└──────────────────────────────────────────────┘
│
▼
┌──────────────────────────────────────────────┐
│ SUPER SMART BASE SIGNALS │
├──────────────────────────────────────────────┤
│ SMART BUY = BullTrend + AboveSMMA + │
│ (RSI Buy OR EMA Cross OR SMA X) │
│ + Near Fibonacci Level │
│ │
│ SMART SELL = BearTrend + BelowSMMA + │
│ (RSI Sell OR EMA Cross OR SMA X)│
│ + Near Fibonacci Level │
└──────────────────────────────────────────────┘
│
▼
┌──────────────────────────────────────────────┐
│ BOOST CONFIRMATIONS │
├──────────────────────────────────────────────┤
│ BOOST BUY = SMART BUY + (RSI>50 OR BullDiv) │
│ BOOST SELL = SMART SELL + (RSI<50 OR BearDiv)│
└──────────────────────────────────────────────┘
│
▼
┌──────────────────────────────────────────────┐
│ SIGNAL STRENGTH CALCULATION (0–100%) │
├──────────────────────────────────────────────┤
│ Points added for: │
│ - Trend alignment │
│ - EMA crosses │
│ - SMMA position │
│ - RSI momentum │
│ - Divergence │
│ - Near Fibonacci │
│ Output = (Total / Max 8) × 100% │
└──────────────────────────────────────────────┘
│
▼
┌──────────────────────────────────────────────┐
│ DASHBOARD │
├──────────────────────────────────────────────┤
│ Displays: │
│ - Signal Type (Buy/Sell/Boost/Neutral) │
│ - Trend Direction │
│ - RSI Value │
│ - Near Fib (Yes/No) │
│ - EMA 9/21 Status │
│ - Signal Strength (%) + Color Gradient │
│ Position: user-selectable (corner) │
└──────────────────────────────────────────────┘
Phát hành các Ghi chú
small update.Phát hành các Ghi chú
small updateMã được bảo vệ
Tập lệnh này được đăng dưới dạng mã nguồn đóng. Tuy nhiên, bạn có thể tự do sử dụng tập lệnh mà không có bất kỳ hạn chế nào – tìm hiểu thêm tại đây.
Thông báo miễn trừ trách nhiệm
Thông tin và ấn phẩm không có nghĩa là và không cấu thành, tài chính, đầu tư, kinh doanh, hoặc các loại lời khuyên hoặc khuyến nghị khác được cung cấp hoặc xác nhận bởi TradingView. Đọc thêm trong Điều khoản sử dụng.
Mã được bảo vệ
Tập lệnh này được đăng dưới dạng mã nguồn đóng. Tuy nhiên, bạn có thể tự do sử dụng tập lệnh mà không có bất kỳ hạn chế nào – tìm hiểu thêm tại đây.
Thông báo miễn trừ trách nhiệm
Thông tin và ấn phẩm không có nghĩa là và không cấu thành, tài chính, đầu tư, kinh doanh, hoặc các loại lời khuyên hoặc khuyến nghị khác được cung cấp hoặc xác nhận bởi TradingView. Đọc thêm trong Điều khoản sử dụng.