OPEN-SOURCE SCRIPT
Dual-Frame Momentum Oscillator
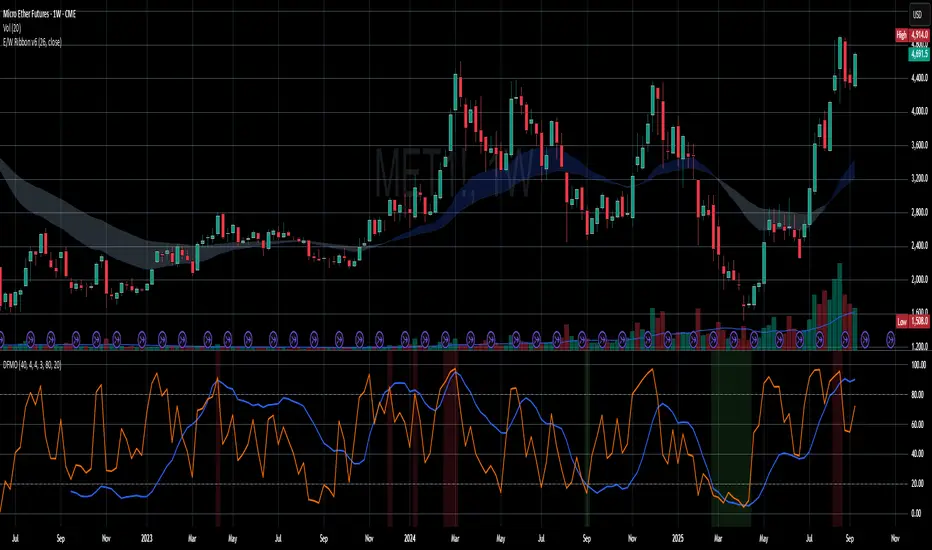
Dual-Frame Momentum Oscillator (DFMO)
This is not just another oscillator. This is a confluence engine, built for the discerning trader who reads the story of price action and needs an objective tool to confirm the climax.
The Dual-Frame Momentum Oscillator was designed to solve a specific problem: how to differentiate a genuine, sustainable breakout from an exhaustive liquidity grab. It provides a visual confirmation for high-probability reversal and scalp setups by measuring momentum across two distinct time frames simultaneously.
This tool is for the trader who understands that indicators should not dictate trades, but rather confirm a well-defined thesis based on market structure, volume, and liquidity.
The Core Concept: Context Meets Trigger
The DFMO fuses a slow, methodical Stochastic with a hyper-sensitive RSI to give you a complete picture of momentum.
The Context (Slow Stochastic %K - default 40,4,4): This acts as your long-term momentum gauge. It tells you if the underlying trend is healthy or nearing exhaustion. A high reading suggests the market is overextended and vulnerable, while a low reading suggests the opposite.
The Trigger (Fast RSI - default 3): This is your immediate impulse reader. It measures the velocity and intensity of the current price thrust, making it incredibly sensitive to exhaustive moves, spikes, and bounces.
By themselves, they are useful. Together, they are formidable.
The Confluence Engine: Your Visual Edge
The true power of the DFMO lies in its "Confluence Engine." The indicator's background highlights in real-time when both oscillators are in agreement, visually flagging moments of maximum opportunity.
Bearish Confluence Zone (Red): The background turns red only when the Stochastic is overbought AND the RSI is overbought. This is your signal that the broader trend is exhausted and the current buying impulse has reached a climax. It is the ideal confirmation for a short entry following a liquidity sweep above a key high.
Bullish Confluence Zone (Green): The background turns green only when the Stochastic is oversold AND the RSI is oversold. This signals that the downtrend is tired and the immediate selling pressure is exhaustive, providing high-probability confirmation for a long entry at a key support level.
When these zones appear, the indicator is telling you that both the context and the trigger are aligned. This removes ambiguity and allows for decisive, confident execution.
Practical Application: The Liquidity Sweep
Imagine you're stalking a short on a futures contract like MCL or MES. You've marked the high of the day (HOD) as a key resistance level where liquidity is resting. You see a sharp, vertical impulse move that breaks the HOD, clearing out the stops.
Is this a real breakout, or is it a manipulation move—a classic liquidity grab?
You glance down at the DFMO. The moment price swept the high, the background flashed red. That's your objective confirmation. The slow Stoch was already overbought, and the fast RSI spiking confirmed the exhaustive, terminal nature of that price thrust. You now have the confidence to enter your short scalp, knowing you are aligned with the probable direction of the market's next move.
This is how you move from "feeling" the market to systematically executing a high-probability edge. This is how you aspire for greatness.
Add the Dual-Frame Momentum Oscillator to your toolkit and transform your ability to time entries with surgical precision.
Mã nguồn mở
Theo đúng tinh thần TradingView, tác giả của tập lệnh này đã công bố nó dưới dạng mã nguồn mở, để các nhà giao dịch có thể xem xét và xác minh chức năng. Chúc mừng tác giả! Mặc dù bạn có thể sử dụng miễn phí, hãy nhớ rằng việc công bố lại mã phải tuân theo Nội quy.
Richard Etter
Thông báo miễn trừ trách nhiệm
Thông tin và các ấn phẩm này không nhằm mục đích, và không cấu thành, lời khuyên hoặc khuyến nghị về tài chính, đầu tư, giao dịch hay các loại khác do TradingView cung cấp hoặc xác nhận. Đọc thêm tại Điều khoản Sử dụng.