OPEN-SOURCE SCRIPT
Candlestick Combo Strategy - [CLEVER]
📊 Strategy Name:
Candlestick Combo Strategy – [CLEVER]
🧠 Purpose
This strategy is built to identify high-probability reversal or continuation setups based on a combination of classic Japanese candlestick patterns filtered through a trend indicator (50-period SMA) and volatility measure (ATR).
It automatically executes long or short trades when multiple conditions align — giving traders a rules-based, mechanical approach to using price action patterns.
⚙️ Core Components Explained
1. Trend & Volatility Filters
50-period SMA (Simple Moving Average):
Defines market direction.
If price > SMA → Uptrend (only long signals considered).
If price < SMA → Downtrend (only short signals considered).
ATR (Average True Range):
Used to measure volatility and define the size of candlestick patterns.
Helps distinguish strong candles from normal noise.
Also used to calculate stop-loss and target levels dynamically.
2. Candlestick Patterns Detected
The script detects 8 classical patterns, some bullish (for long entries) and some bearish (for short entries).
Each pattern has specific rules based on candle bodies, wicks, and relative positioning.
🟩 Bullish (Long) Patterns
Pattern Description
Mat Hold Strong bullish continuation: a long green candle, small consolidation, then another bullish breakout.
Tower Bottom Reversal setup: large bearish candle, several small neutral candles (base), followed by a large bullish candle.
Rising Window Gap-up pattern signaling bullish strength and momentum continuation.
Bullish Marubozu Full-body bullish candle with little to no wicks — represents aggressive buying pressure.
🟥 Bearish (Short) Patterns
Pattern Description
Matching High Two strong bullish candles with nearly identical highs — signals exhaustion and potential reversal.
Falling Window Gap-down continuation pattern — confirms bearish momentum.
Bearish Marubozu Full-body bearish candle with minimal wicks — represents strong selling pressure.
Long-Legged Doji High indecision after an uptrend — potential reversal warning when confirmed by trend filter.
3. Trade Signal Logic
Long Signal:
Generated when the market is in an uptrend and one of the bullish patterns forms.
Short Signal:
Generated when the market is in a downtrend and one of the bearish patterns appears.
This ensures that signals align with the overall market structure and aren’t triggered in the opposite direction of momentum.
4. Risk Management & Trade Execution
Each trade is managed with automatic stop-loss (SL) and take-profit (TP) levels based on recent price swings and risk-to-reward ratio.
Stop-Loss (SL):
For long trades → lowest low of the last 10 bars.
For short trades → highest high of the last 10 bars.
Target (TP):
Based on user-defined risk:reward ratio (RR), default is 2:1.
ATR Multiplier:
Ensures only strong patterns (larger than average candle size) trigger trades.
Trade Limiter:
The strategy includes maxOpenTrades, which restricts how many trades can be open at once (default = 1), preventing overexposure.
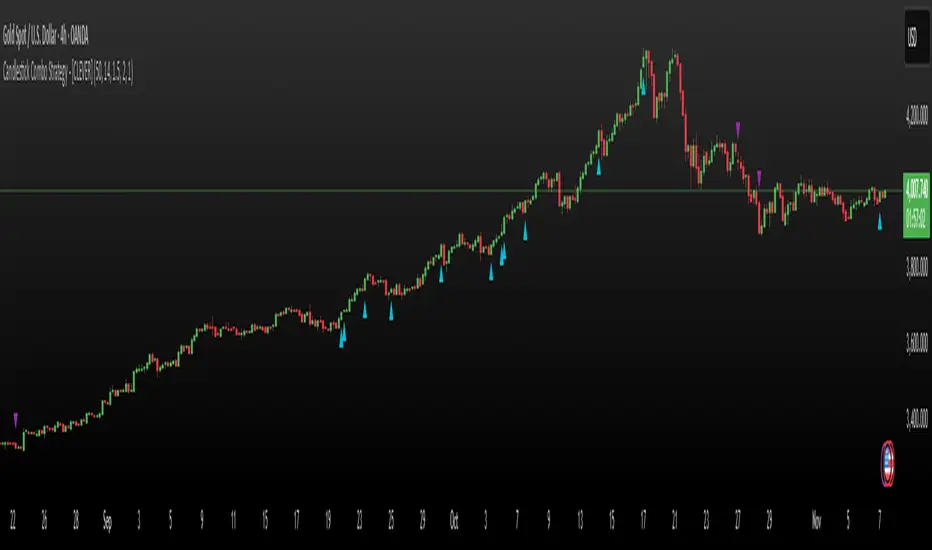
5. Visual Signals
Green Triangles (▲) → Long entry signals appear below candles.
Red Triangles (▼) → Short entry signals appear above candles.
These markers visually represent where the strategy detects valid setups.
💡 Trading Logic Summary
Condition Requirement
Trend Based on 50-SMA (uptrend = long, downtrend = short)
Pattern Strength Verified using ATR for realistic volatility filtering
Entry Triggered only when both trend and pattern align
Exit Stop and target auto-calculated (Risk:Reward = configurable)
Trade Control Limits number of concurrent open positions
🧩 Best Use Cases
Timeframes: Works best on 1H, 4H, or daily charts.
Markets: Suitable for Forex, indices, and commodities.
Trading Style: Ideal for swing traders and technical analysts who prefer price action confirmation.
✅ Summary Table
Feature Description
Strategy Type Price Action + Candlestick Pattern Recognition
Trend Filter 50-SMA
Volatility Filter ATR-based
Patterns Used 8 classic bullish/bearish candlestick formations
Trade Management Auto SL/TP via recent swing levels
Customization Adjustable ATR, SMA, Risk:Reward, and max trades
Objective Identify high-probability reversal or continuation setups with disciplined risk control DXY
DXY  XAUUSD
 AUDJPY
 GBPMXN
  BTCUSD
  USOIL
USOIL 
 USDCHF
  NOKJPY
  SEKJPY
Candlestick Combo Strategy – [CLEVER]
🧠 Purpose
This strategy is built to identify high-probability reversal or continuation setups based on a combination of classic Japanese candlestick patterns filtered through a trend indicator (50-period SMA) and volatility measure (ATR).
It automatically executes long or short trades when multiple conditions align — giving traders a rules-based, mechanical approach to using price action patterns.
⚙️ Core Components Explained
1. Trend & Volatility Filters
50-period SMA (Simple Moving Average):
Defines market direction.
If price > SMA → Uptrend (only long signals considered).
If price < SMA → Downtrend (only short signals considered).
ATR (Average True Range):
Used to measure volatility and define the size of candlestick patterns.
Helps distinguish strong candles from normal noise.
Also used to calculate stop-loss and target levels dynamically.
2. Candlestick Patterns Detected
The script detects 8 classical patterns, some bullish (for long entries) and some bearish (for short entries).
Each pattern has specific rules based on candle bodies, wicks, and relative positioning.
🟩 Bullish (Long) Patterns
Pattern Description
Mat Hold Strong bullish continuation: a long green candle, small consolidation, then another bullish breakout.
Tower Bottom Reversal setup: large bearish candle, several small neutral candles (base), followed by a large bullish candle.
Rising Window Gap-up pattern signaling bullish strength and momentum continuation.
Bullish Marubozu Full-body bullish candle with little to no wicks — represents aggressive buying pressure.
🟥 Bearish (Short) Patterns
Pattern Description
Matching High Two strong bullish candles with nearly identical highs — signals exhaustion and potential reversal.
Falling Window Gap-down continuation pattern — confirms bearish momentum.
Bearish Marubozu Full-body bearish candle with minimal wicks — represents strong selling pressure.
Long-Legged Doji High indecision after an uptrend — potential reversal warning when confirmed by trend filter.
3. Trade Signal Logic
Long Signal:
Generated when the market is in an uptrend and one of the bullish patterns forms.
Short Signal:
Generated when the market is in a downtrend and one of the bearish patterns appears.
This ensures that signals align with the overall market structure and aren’t triggered in the opposite direction of momentum.
4. Risk Management & Trade Execution
Each trade is managed with automatic stop-loss (SL) and take-profit (TP) levels based on recent price swings and risk-to-reward ratio.
Stop-Loss (SL):
For long trades → lowest low of the last 10 bars.
For short trades → highest high of the last 10 bars.
Target (TP):
Based on user-defined risk:reward ratio (RR), default is 2:1.
ATR Multiplier:
Ensures only strong patterns (larger than average candle size) trigger trades.
Trade Limiter:
The strategy includes maxOpenTrades, which restricts how many trades can be open at once (default = 1), preventing overexposure.
5. Visual Signals
Green Triangles (▲) → Long entry signals appear below candles.
Red Triangles (▼) → Short entry signals appear above candles.
These markers visually represent where the strategy detects valid setups.
💡 Trading Logic Summary
Condition Requirement
Trend Based on 50-SMA (uptrend = long, downtrend = short)
Pattern Strength Verified using ATR for realistic volatility filtering
Entry Triggered only when both trend and pattern align
Exit Stop and target auto-calculated (Risk:Reward = configurable)
Trade Control Limits number of concurrent open positions
🧩 Best Use Cases
Timeframes: Works best on 1H, 4H, or daily charts.
Markets: Suitable for Forex, indices, and commodities.
Trading Style: Ideal for swing traders and technical analysts who prefer price action confirmation.
✅ Summary Table
Feature Description
Strategy Type Price Action + Candlestick Pattern Recognition
Trend Filter 50-SMA
Volatility Filter ATR-based
Patterns Used 8 classic bullish/bearish candlestick formations
Trade Management Auto SL/TP via recent swing levels
Customization Adjustable ATR, SMA, Risk:Reward, and max trades
Objective Identify high-probability reversal or continuation setups with disciplined risk control
Mã nguồn mở
Theo đúng tinh thần TradingView, người tạo ra tập lệnh này đã biến tập lệnh thành mã nguồn mở để các nhà giao dịch có thể xem xét và xác minh công năng. Xin dành lời khen tặng cho tác giả! Mặc dù bạn có thể sử dụng miễn phí, nhưng lưu ý nếu đăng lại mã, bạn phải tuân theo Quy tắc nội bộ của chúng tôi.
Thông báo miễn trừ trách nhiệm
Thông tin và ấn phẩm không có nghĩa là và không cấu thành, tài chính, đầu tư, kinh doanh, hoặc các loại lời khuyên hoặc khuyến nghị khác được cung cấp hoặc xác nhận bởi TradingView. Đọc thêm trong Điều khoản sử dụng.