PROTECTED SOURCE SCRIPT
Rainbow Trend [Mc]
1. Momentum-Based Foundation
2. Long-Term Time Frame
3. Multicolored Gradient Lines
4. Horizontal Levels (Overbought/Oversold Zones)
5. Reversal Signal Markers
- This indicator measures the velocity and strength of price changes.
- Rising momentum indicates that price movement (upward or downward) has strength behind it.
- When momentum weakens or reverses, it often signals a potential trend reversal.
2. Long-Term Time Frame
- Unlike traditional indicators like RSI or Stochastic, which use shorter lookback periods (e.g., 14 days), this indicator uses a much longer period, such as 50 to 200 days.
- This extended range helps smooth out volatility and provides a clearer view of the primary trend.
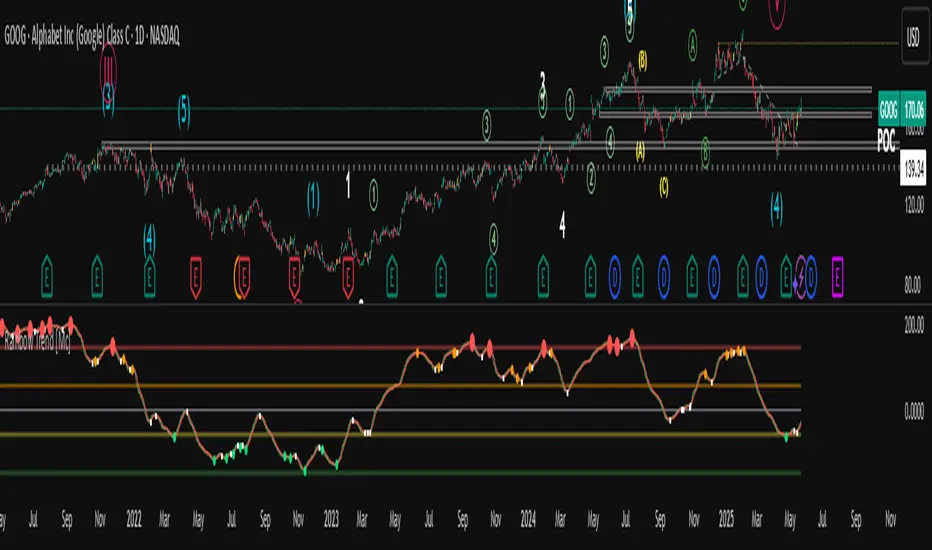
3. Multicolored Gradient Lines
- The indicator displays multi-layered colored curves, often with a rainbow-like gradient.
- Red or pink areas indicate strong selling pressure or peak momentum in an uptrend.
- Green or bright green dots often suggest recovery or bottoming momentum.
- Orange or yellow colors indicate neutral or transition zones, awaiting trend confirmation.
4. Horizontal Levels (Overbought/Oversold Zones)
- The chart includes reference levels such as +160, 0, -40, and -120 (as shown in the image).
- These levels help identify when momentum is reaching overbought or oversold conditions.
- Reversals often begin near the upper or lower extremes of these zones.
5. Reversal Signal Markers
- Red dots at the top indicate extreme bullish momentum and potential topping zones.
- Green dots at the bottom suggest oversold conditions and potential bullish reversals.
Mã được bảo vệ
Tập lệnh này được đăng dưới dạng mã nguồn đóng. Tuy nhiên, bạn có thể sử dụng tự do và không giới hạn – tìm hiểu thêm tại đây.
Thông báo miễn trừ trách nhiệm
Thông tin và các ấn phẩm này không nhằm mục đích, và không cấu thành, lời khuyên hoặc khuyến nghị về tài chính, đầu tư, giao dịch hay các loại khác do TradingView cung cấp hoặc xác nhận. Đọc thêm tại Điều khoản Sử dụng.