OPEN-SOURCE SCRIPT
Percentage Change Indicator

Percentage Change Indicator
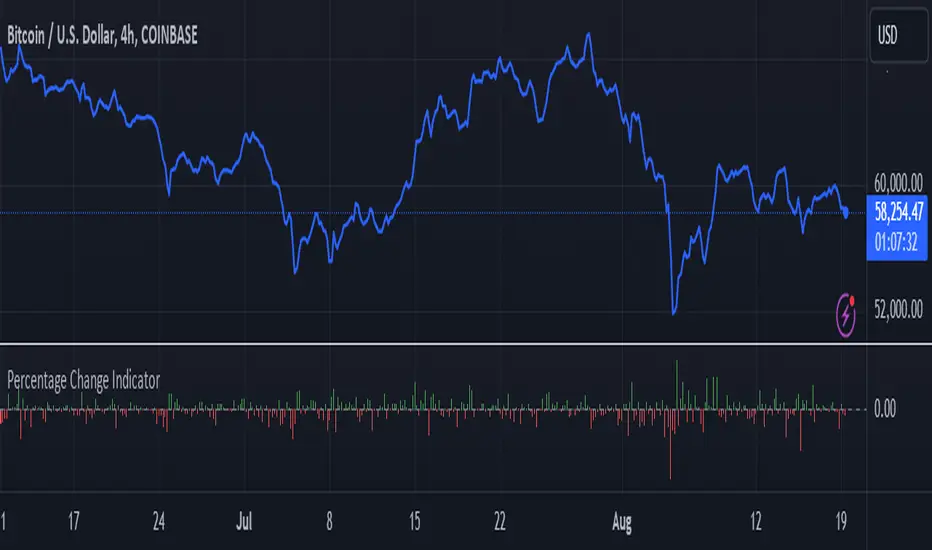
This indicator calculates and displays the percentage change between the current close price and the previous close price. It provides a clear visual representation of price movements, helping traders quickly identify significant changes in the market.
## Formula
The percentage change is calculated using the following formula:
```
Percentage Change = (Current Close - Previous Close) * 100 / Current Close
```
## Features
- Displays percentage change as a bar chart
- Green bars indicate positive changes
- Red bars indicate negative changes
- A horizontal line at 0% helps distinguish between positive and negative movements
## How to Use
1. Add the indicator to your chart
2. Observe the bar chart below your main price chart
3. Green bars above the 0% line indicate upward price movements
4. Red bars below the 0% line indicate downward price movements
5. The height of each bar represents the magnitude of the percentage change
This indicator can be particularly useful for:
- Identifying sudden price spikes or drops
- Analyzing the volatility of an asset
- Comparing price movements across different timeframes
- Spotting potential entry or exit points based on percentage changes
Customize the indicator's appearance in the settings to suit your charting preferences.
Note: This indicator works on all timeframes, adapting its calculations to the selected chart period.
Mã nguồn mở
Theo đúng tinh thần TradingView, tác giả của tập lệnh này đã công bố nó dưới dạng mã nguồn mở, để các nhà giao dịch có thể xem xét và xác minh chức năng. Chúc mừng tác giả! Mặc dù bạn có thể sử dụng miễn phí, hãy nhớ rằng việc công bố lại mã phải tuân theo Nội quy.
Thông báo miễn trừ trách nhiệm
Thông tin và các ấn phẩm này không nhằm mục đích, và không cấu thành, lời khuyên hoặc khuyến nghị về tài chính, đầu tư, giao dịch hay các loại khác do TradingView cung cấp hoặc xác nhận. Đọc thêm tại Điều khoản Sử dụng.