PROTECTED SOURCE SCRIPT
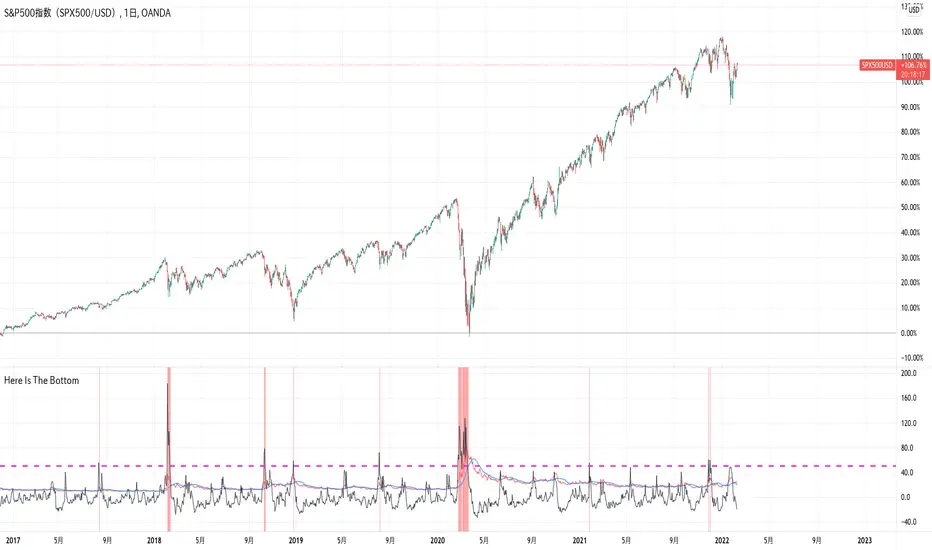
Here Is The Bottom(VIX and Its MA Deviation Rate)

I found a very interesting article on Bloomberg with the title “JP Morgan Strategists See Sure Fire Sign It Is Time to Buy Stocks”.
It says when VIX index far exceeds its 1 month MA by 50%, then stock prices rise later except recession period. This buying signals are almost 100% accurate and now is the time to buy stocks as the VIX met the condition on Jan25 this year, the article says.
I can’t post the URL of the article here as it violates TradingView house rules, so if you are interested, you just google it with the title.
Anyway, I have developed this indicator to see what JP Morgan says.
It draws VIX, its MA and its MA deviation rate.
You will see the truth.
Enjoy!
Mã được bảo vệ
Tập lệnh này được đăng dưới dạng mã nguồn đóng. Tuy nhiên, bạn có thể tự do sử dụng tập lệnh mà không có bất kỳ hạn chế nào – tìm hiểu thêm tại đây.
■”なぜ”がわかる相場分析
・チャートの動きというファクトを元に
・客観的かつロジカルに
・初心者でもわかるように
相場展望を解説
Followすると投稿の度に通知が届きます。
bit.ly/3s888QI
■Editor's Pick
bit.ly/3pkLCEl
■Blog
bit.ly/2VPAMJk
■Indicator
bit.ly/3lmWYFk
■Membership
bit.ly/3zvLkPG
・チャートの動きというファクトを元に
・客観的かつロジカルに
・初心者でもわかるように
相場展望を解説
Followすると投稿の度に通知が届きます。
bit.ly/3s888QI
■Editor's Pick
bit.ly/3pkLCEl
■Blog
bit.ly/2VPAMJk
■Indicator
bit.ly/3lmWYFk
■Membership
bit.ly/3zvLkPG
Thông báo miễn trừ trách nhiệm
Thông tin và ấn phẩm không có nghĩa là và không cấu thành, tài chính, đầu tư, kinh doanh, hoặc các loại lời khuyên hoặc khuyến nghị khác được cung cấp hoặc xác nhận bởi TradingView. Đọc thêm trong Điều khoản sử dụng.