PROTECTED SOURCE SCRIPT
Cập nhật SADX+DI - Smoothed Average Directional Index by CrypTaux
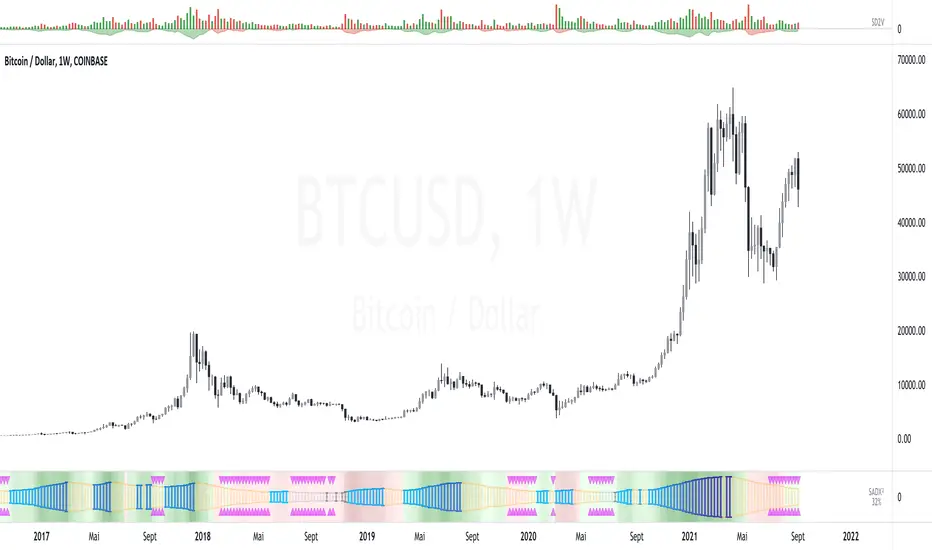
This script is based on ADX/DI and I use it to enter when trend is in early stage, then ride it & exit at the right time (that's the theory)
ADX is shown as histogram :
- light silver bars = price is under thresold but still no trend, be patient.
- strong gray bars = prepare to enter the trade soon
- blue bars = price momentum so ride the trend
- yellow bars = do not trade (price reverts or consolidates)
Background color/bottom area based on DI+/DI- :
- green = uptrend
- red = downtrend
Top pink triangles appears when ADX is relatively low based on "lookback" history (not based on previous static threshold) so a new trend may happens so stay alerts.
- Prepare for enter when bars turn dark gray and/or pink triangles appears.
- Enter position as soon as you see blue bar (Long or Short as indicated by the area color)
- and Exit on first yellow bar.
Quite simple, works on multiple HTF/LTF and might be used with graphical analysis to find best opportunities.
Enjoy :)
--
Version 35.
Phát hành các Ghi chú
SADX V2 :- Updated SADX bars visualization (mirror mode),
- Set Background color to reflect uptrend (green) or downtrend (red) period,
- [OPTIONAL] Added BBW (Bollinger Bands Width) lines and Squeeze indicator that may complete SADX extensions/compressions/squeeze periods,
- [OPTIONAL] Added ATR (Average True Range) Squeeze indicator (squares) that very often precedes a relative bigger candle or move.
Phát hành các Ghi chú
Cosmetic fix : updated TradingView graph to show Price and SADX indicator only.Mã được bảo vệ
Tập lệnh này được đăng dưới dạng mã nguồn đóng. Tuy nhiên, bạn có thể sử dụng tự do và không giới hạn – tìm hiểu thêm tại đây.
All my stuff @ go2.st/CTH
BTC : bc1qlufls5at2706s53y4naqnm9q58jjaj3nk4cm4w
Disclaimer : No financial advice. Ideas & scripts are for educational purpose only, always do your own research.
BTC : bc1qlufls5at2706s53y4naqnm9q58jjaj3nk4cm4w
Disclaimer : No financial advice. Ideas & scripts are for educational purpose only, always do your own research.
Thông báo miễn trừ trách nhiệm
Thông tin và các ấn phẩm này không nhằm mục đích, và không cấu thành, lời khuyên hoặc khuyến nghị về tài chính, đầu tư, giao dịch hay các loại khác do TradingView cung cấp hoặc xác nhận. Đọc thêm tại Điều khoản Sử dụng.
Mã được bảo vệ
Tập lệnh này được đăng dưới dạng mã nguồn đóng. Tuy nhiên, bạn có thể sử dụng tự do và không giới hạn – tìm hiểu thêm tại đây.
All my stuff @ go2.st/CTH
BTC : bc1qlufls5at2706s53y4naqnm9q58jjaj3nk4cm4w
Disclaimer : No financial advice. Ideas & scripts are for educational purpose only, always do your own research.
BTC : bc1qlufls5at2706s53y4naqnm9q58jjaj3nk4cm4w
Disclaimer : No financial advice. Ideas & scripts are for educational purpose only, always do your own research.
Thông báo miễn trừ trách nhiệm
Thông tin và các ấn phẩm này không nhằm mục đích, và không cấu thành, lời khuyên hoặc khuyến nghị về tài chính, đầu tư, giao dịch hay các loại khác do TradingView cung cấp hoặc xác nhận. Đọc thêm tại Điều khoản Sử dụng.