OPEN-SOURCE SCRIPT
True Range Momentum
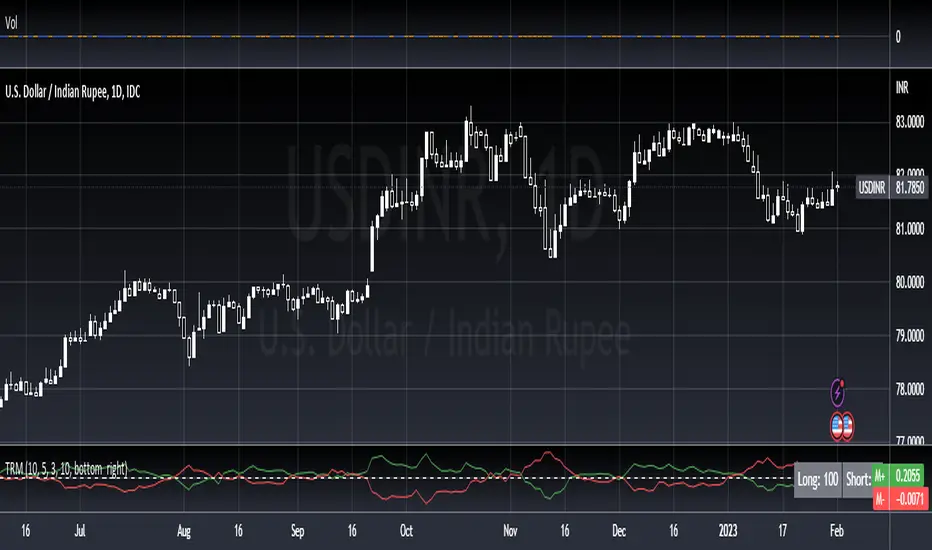
The indicator calculates the momentum of bullish and bearish based on the average true range and the highest highs and lowest lows of the historical price.
The indicator displays the strength for either taking a long position, or a short position.
The simplest way to use the indicator is to take a long position when the M+ line crosses above the 0 line. Similarly, to short, the M- line should cross above the 0 line. The exit would be when the respective line crosses below the 0 line.
The contrarian traders should wait for the lines to start rising towards the 0 line and taking an exit. In essence, the line should be going from negative to 0.
The greater the divergence between the M+ and M-, the stronger the trend.
The small table of Long and Short suggests what is in strength. A 100 will show a strong trend in the respective direction. It will be 50-50 when there is no clear direction, ideally identifying a consolidation range.
Mã nguồn mở
Theo đúng tinh thần TradingView, tác giả của tập lệnh này đã công bố nó dưới dạng mã nguồn mở, để các nhà giao dịch có thể xem xét và xác minh chức năng. Chúc mừng tác giả! Mặc dù bạn có thể sử dụng miễn phí, hãy nhớ rằng việc công bố lại mã phải tuân theo Nội quy.
Thông báo miễn trừ trách nhiệm
Thông tin và các ấn phẩm này không nhằm mục đích, và không cấu thành, lời khuyên hoặc khuyến nghị về tài chính, đầu tư, giao dịch hay các loại khác do TradingView cung cấp hoặc xác nhận. Đọc thêm tại Điều khoản Sử dụng.