PROTECTED SOURCE SCRIPT
Choppy Market Meter x SmartBlackGirl
How It Works
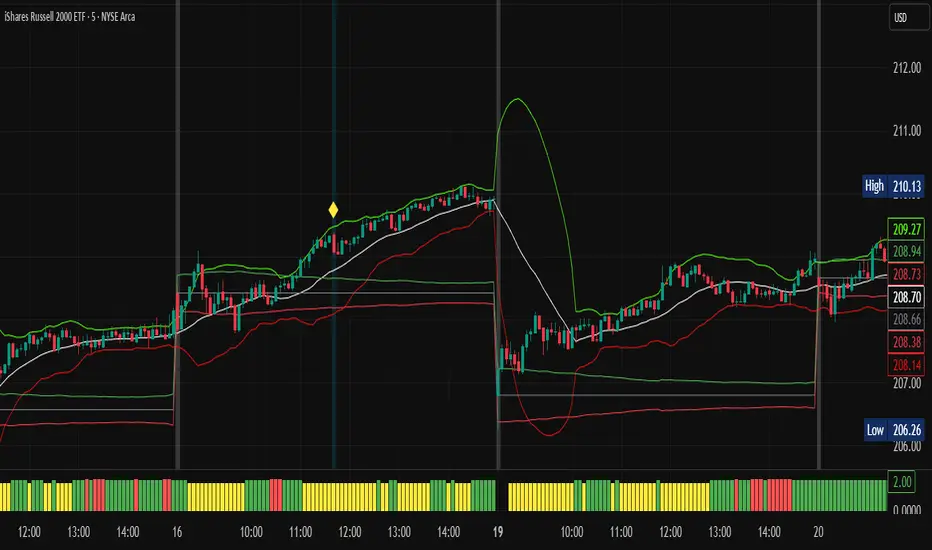
The indicator measures compression or indecision by analyzing Bollinger Band Width (BBW), volume, and price behavior. It plots a bar graph or colored meter under your chart showing:
🔴 Red (Chop Zone) – Market is consolidating or stuck in a tight range. Avoid trading.
🟡 Yellow (Transition) – Volatility may be increasing. Watch for breakouts.
🟢 Green (Breakout Zone) – Volatility has expanded, and the market is likely trending. This is the best time to trade momentum-based setups.
✅ Best Times to Trade with the Chop Meter
Wait for the bar to turn green or exit the red zone.
Confirm with other signals like:
Breakouts from Bollinger Band squeezes
Volume surge
Directional bias (e.g., from ORB box or higher timeframe trend)
Avoid trades during red chop bars, as breakouts often fail and get reversed.
Use the Chop Meter as a filter, not a signal. Combine it with your breakout or momentum strategy (e.g., BB Squeeze, ORB Box) to increase win rate and avoid trading noise.
Mã được bảo vệ
Tập lệnh này được đăng dưới dạng mã nguồn đóng. Tuy nhiên, bạn có thể tự do sử dụng tập lệnh mà không có bất kỳ hạn chế nào – tìm hiểu thêm tại đây.
Thông báo miễn trừ trách nhiệm
Thông tin và ấn phẩm không có nghĩa là và không cấu thành, tài chính, đầu tư, kinh doanh, hoặc các loại lời khuyên hoặc khuyến nghị khác được cung cấp hoặc xác nhận bởi TradingView. Đọc thêm trong Điều khoản sử dụng.