PROTECTED SOURCE SCRIPT
π Cycle Market Tops & Bottoms Performante Indicator
Why is it called the Pi Cycle Tops & Bottoms Indicator?
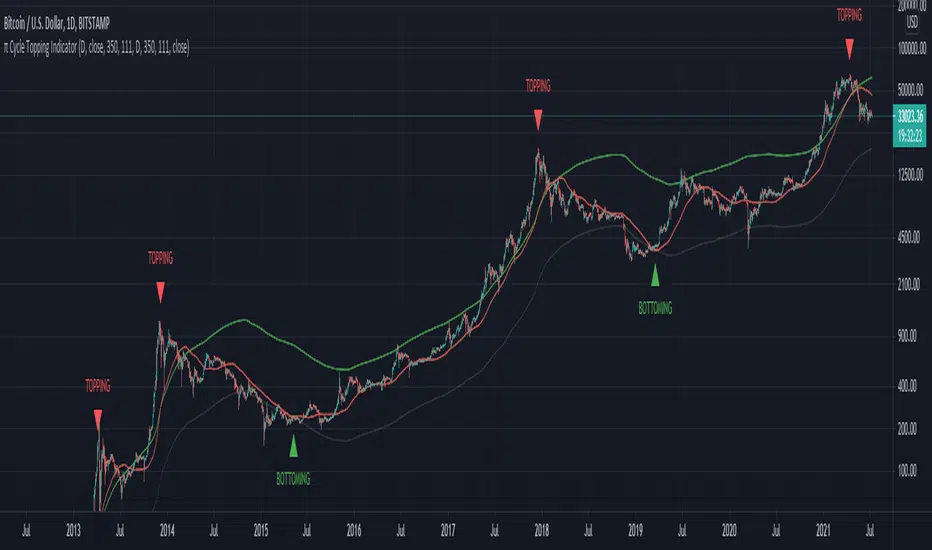
When the 111-Day moving average crosses over the (350-Day moving average X 2), we've seen the price come to a key top or bottom within the Bitcoin market for the past 3 cycles.
350 divided by 111 is very close to π - hence the name the Pie cycle!
Yes, we are selecting arbitrary numbers initially, but through the use of proper back-testing, we are able to find key cycle shifts using mathematical numbers (fibs, Pi, etc)
We use this topping & bottoming signal when things look overbought over oversold within the market.
The "topping" label turns on as soon as we see the 111-Day moving average cross above the 350-Day moving average.
The "bottoming" signal turns on as soon as we see the 111-day moving average cross below the 350-Day moving average.
This indicator should only be used on the daily timeframe!
Historically speaking, we've seen this indicator become impressively accurate.
Mã được bảo vệ
Tập lệnh này được đăng dưới dạng mã nguồn đóng. Tuy nhiên, bạn có thể sử dụng tự do và không giới hạn – tìm hiểu thêm tại đây.
Thông báo miễn trừ trách nhiệm
Thông tin và các ấn phẩm này không nhằm mục đích, và không cấu thành, lời khuyên hoặc khuyến nghị về tài chính, đầu tư, giao dịch hay các loại khác do TradingView cung cấp hoặc xác nhận. Đọc thêm tại Điều khoản Sử dụng.