PROTECTED SOURCE SCRIPT
Cập nhật Pivot Points Standard M, W, D (Monthly, Weekly & Daily)
This script is based on Pivot Point Standard and is intended for educational purposes only.
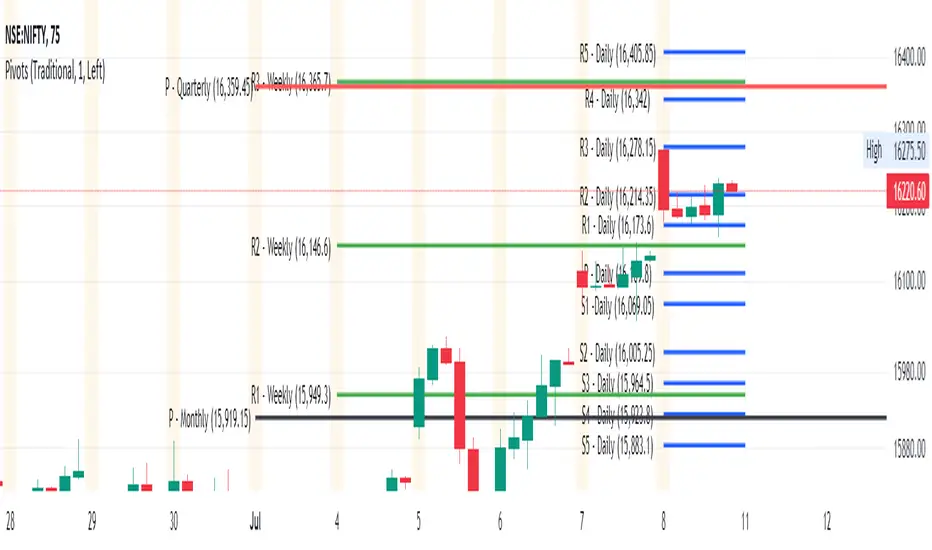
"Pivot points are a technical indicator that is used to determine the levels at which price may face support or resistance.
Pivot Points indicator consists of a Pivot (P) level, several support (S) and several resistance (R)."
You can view the Daily timeframe - support/resistance.
You can view the Weekly timeframe - support/resistance.
You can view the Monthly timeframe - support/resistance.
Options to choose "Traditional" or "Fibonacci" or "Woodie" or "Classic" or "DM" or "Camarilla"
Options to choose historical pivots (Number of Pivots Back)
This tool can be handy in any trading process from short-long term trades or timeframes, multiple timeframe analysis, trend trades, swing trades, position trades, and momentum trades.
Credits
Credits to TradingView for original built-in source code
Phát hành các Ghi chú
July 2022 Update Option to Change the Colour for Daily / Weekly / Monthly Pivots
Option to Show Prices
Phát hành các Ghi chú
Pivots Quarterly and Pivots Yearly Timeframe addedOption to Choose the Timeframe Daily / Weekly / Monthly / Quarterly / Yearly Pivots
Option to Change the Color for Daily / Weekly / Monthly / Quarterly / Yearly Pivots
Mã được bảo vệ
Tập lệnh này được đăng dưới dạng mã nguồn đóng. Tuy nhiên, bạn có thể sử dụng tự do và không giới hạn – tìm hiểu thêm tại đây.
Thông báo miễn trừ trách nhiệm
Thông tin và các ấn phẩm này không nhằm mục đích, và không cấu thành, lời khuyên hoặc khuyến nghị về tài chính, đầu tư, giao dịch hay các loại khác do TradingView cung cấp hoặc xác nhận. Đọc thêm tại Điều khoản Sử dụng.