PROTECTED SOURCE SCRIPT
Cập nhật Global Index EMA Quadrants
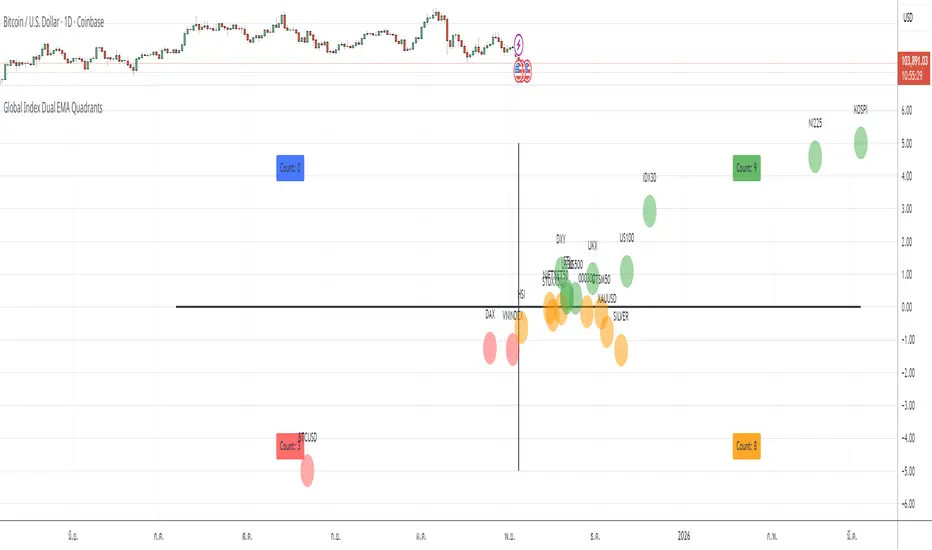
This indicator displays global market indices on a 2D quadrant matrix based on their percentage distance from a selected EMA length across two different timeframes.
Features
• X-axis: % distance from EMA on a higher timeframe (default Weekly)
• Y-axis: % distance from EMA on a lower timeframe (default Daily)
• Bubble colors represent quadrants
• Count labels show how many indices are in each quadrant
How to Use
Select your preferred X timeframe, Y timeframe, and EMA length from the settings panel.
Analyze which quadrant each index is currently in to assess market momentum and breadth.
The zero axes represent the EMA level on each timeframe.
Notes
• This indicator uses only built-in request.security() data from TradingView
• No external APIs, personal data, or third-party content are used
• Designed purely for educational and market breadth analysis purposes
Phát hành các Ghi chú
add BTC and SilverPhát hành các Ghi chú
fixed bugPhát hành các Ghi chú
"SSE:000001" ---> "SSE:000300" Phát hành các Ghi chú
This update introduces full dual-EMA support for both axes:You can now set different EMA lengths for the horizontal (X) and vertical (Y) timeframes independently.
Previously, the script only used one shared EMA length for both axes.
Enhancements included:
Independent inputs for EMA Length (Horizontal) and EMA Length (Vertical)
Cleaner layout: unnecessary parameters removed (only TF and EMA inputs remain visible)
Optimized tooltip display with both EMA % comparisons shown clearly
Improved performance and reduced label errors
This makes it easier to visualize how global indices move relative to their own short-term vs long-term EMA trends.
🇹🇭 คำอธิบายอัปเดต (ภาษาไทย)
เวอร์ชัน: Dual EMA (อัปเกรดสองเส้น)
อัปเดตนี้เพิ่มความสามารถในการใช้ ค่า EMA แยกกันระหว่างแกนแนวนอน (X) และ แกนแนวตั้ง (Y)
เดิมทีสคริปต์ใช้ค่า EMA เส้นเดียวร่วมกันทั้งสองแกน
ตอนนี้สามารถกำหนดค่า EMA ของแต่ละแกนได้อย่างอิสระแล้ว
สิ่งที่ปรับปรุงเพิ่มเติม:
เพิ่มช่องตั้งค่าแยกสำหรับ EMA Length (Horizontal) และ EMA Length (Vertical)
ซ่อนการตั้งค่าที่ไม่จำเป็น เหลือเฉพาะ TF และ EMA เท่านั้น
ปรับ tooltip แสดงข้อมูลเปอร์เซ็นต์เหนือ/ใต้ EMA ทั้งสอง TF ชัดเจน
ปรับโค้ดให้ทำงานเร็วขึ้นและลดข้อผิดพลาดในการสร้าง label
ช่วยให้วิเคราะห์แนวโน้มระยะสั้น–ระยะยาวของดัชนีโลกได้เข้าใจง่ายขึ้นในมุมมองเชิงสองมิติ 🌎📊
Phát hành các Ghi chú
fix bugand change SET to DXY
Mã được bảo vệ
Tập lệnh này được đăng dưới dạng mã nguồn đóng. Tuy nhiên, bạn có thể sử dụng tự do và không giới hạn – tìm hiểu thêm tại đây.
Thông báo miễn trừ trách nhiệm
Thông tin và các ấn phẩm này không nhằm mục đích, và không cấu thành, lời khuyên hoặc khuyến nghị về tài chính, đầu tư, giao dịch hay các loại khác do TradingView cung cấp hoặc xác nhận. Đọc thêm tại Điều khoản Sử dụng.