OPEN-SOURCE SCRIPT
ka66: Volatility Momentum
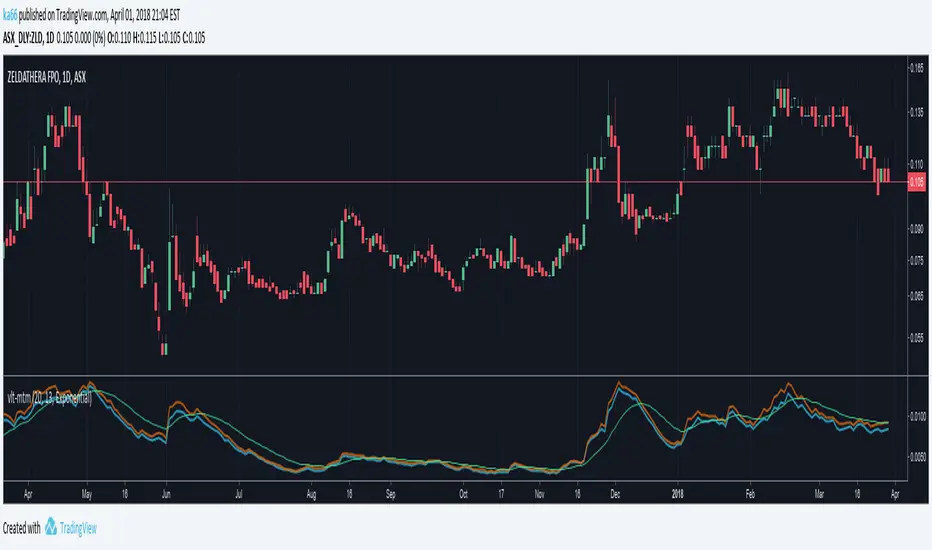
This is a 'monitoring' indicator to see if an instrument is viable enough to be traded, by virtue of volatility (or lack of volatility in context may lead to a break out), or may become so. It shows the following information:
Price Range (high - low) averaged across a set of bars: Useful gauging potential trading profits. This was its initial goal, to not measure bars manually!
ATR: As a comparison point for the price range above. Divergence between true range (TR) and plain price range might signal volatility changes occurring in the instrument.
Signal volatility line: a moving average of the larger of the average price range and ATR. This takes inspiration from other indicators like MACD and Stochastic, and is a way of comparing change in recent volatility --- this achieves the momentum part. The larger was chosen to keep things simple, and not have a signal line per range!
avgRange = movingAvg(high - low, avgPeriod)
atr = movingAvg(trueRange, avgPeriod)
signal = movingAvg(max(avgRange, atr), avgPeriod)
Configurable periods and averaging mechanism.
Mã nguồn mở
Theo đúng tinh thần TradingView, tác giả của tập lệnh này đã công bố nó dưới dạng mã nguồn mở, để các nhà giao dịch có thể xem xét và xác minh chức năng. Chúc mừng tác giả! Mặc dù bạn có thể sử dụng miễn phí, hãy nhớ rằng việc công bố lại mã phải tuân theo Nội quy.
Thông báo miễn trừ trách nhiệm
Thông tin và các ấn phẩm này không nhằm mục đích, và không cấu thành, lời khuyên hoặc khuyến nghị về tài chính, đầu tư, giao dịch hay các loại khác do TradingView cung cấp hoặc xác nhận. Đọc thêm tại Điều khoản Sử dụng.