PROTECTED SOURCE SCRIPT
matrix momentum package
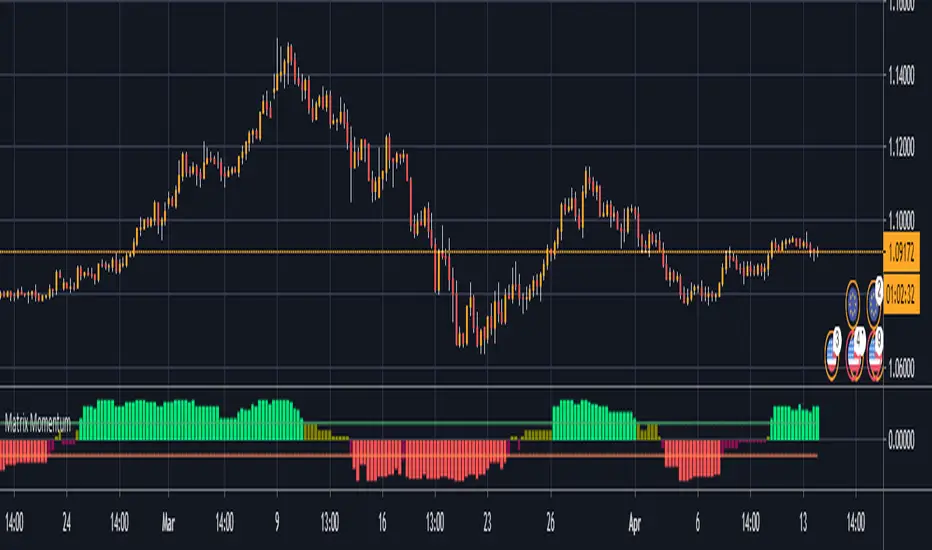
This indicator gives a score to the momentum of a market in a percentage term based on a combination of measurements, this can be used on any time frame, on any instrument to identify if the current trend has enough momentum to see it carry on further this will help eliminate fomo and also help you to identify reversals in the chart at the right time so you can eliminate exposure to a market about to reverse, there is 4 levels to this indicator you have a strong bullish trend denote by green bars the weaker bullish trend denoted by the olive coloured bars, a weak bearish trend which is given in maroon bars and a strong bearish trend which gives red bars you will also note the 2 horizontal boundary lines these are not overbought and oversold bounds like in most indicators but actually indicate whether there is sufficient momentum in the market as the idea is that in strong momentum you want it to be above or below this line to give you confidence there is momentum available to ride
Mã được bảo vệ
Tập lệnh này được đăng dưới dạng mã nguồn đóng. Tuy nhiên, bạn có thể sử dụng tự do và không giới hạn – tìm hiểu thêm tại đây.
Thông báo miễn trừ trách nhiệm
Thông tin và các ấn phẩm này không nhằm mục đích, và không cấu thành, lời khuyên hoặc khuyến nghị về tài chính, đầu tư, giao dịch hay các loại khác do TradingView cung cấp hoặc xác nhận. Đọc thêm tại Điều khoản Sử dụng.