OPEN-SOURCE SCRIPT
Linear Regression Volume Profile [ChartPrime]

LR VolumeProfile [ChartPrime]
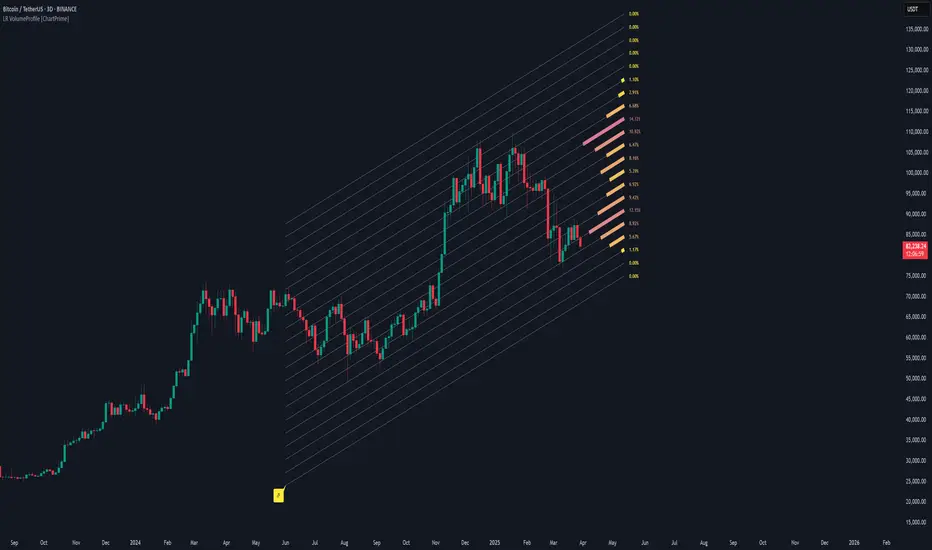
This indicator combines a Linear Regression channel with a dynamic volume profile, giving traders a powerful way to visualize both directional price movement and volume concentration along the trend.
⯁ KEY FEATURES
⯁ HOW TO USE
⯁ CONCLUSION
LR Volume Profile [ChartPrime] is a precision tool for traders who want to merge trend analysis with volume insight. By integrating linear regression trendlines with a clean and readable volume distribution, this indicator helps traders find price levels that matter the most—backed by volume, trend, and structure. Whether you're spotting high-volume nodes or gauging directional flow, this toolkit elevates your decision-making process with clarity and depth.
This indicator combines a Linear Regression channel with a dynamic volume profile, giving traders a powerful way to visualize both directional price movement and volume concentration along the trend.
⯁ KEY FEATURES
- Linear Regression Channel: Draws a statistically fitted channel to track the market trend over a defined period.
- Volume Profile Overlay: Splits the channel into multiple horizontal levels and calculates volume traded within each level.
- Percentage-Based Labels: Displays each level's share of total volume as a percentage, offering a clean way to see high and low volume zones.
- Gradient Bars: Profile bars are colored using a gradient scale from yellow (low volume) to red (high volume), making it easy to identify key interest areas.
- Adjustable Profile Width and Resolution: Users can change the width of profile bars and spacing between levels.
- Channel Direction Indicator: An arrow inside a floating label shows the direction (up or down) of the current linear regression slope.
- Level Style Customization: Choose from solid, dashed, or dotted lines for visual preference.
⯁ HOW TO USE
- Use the Linear Regression channel to determine the dominant price trend direction.
- Analyze the volume bars to spot key levels where the majority of volume was traded—these act as potential support/resistance zones.
- Pay attention to the largest profile bars—these often mark zones of institutional interest or price consolidation.
- The arrow label helps quickly assess whether the trend is upward or downward.
- Combine this tool with price action or momentum indicators to build high-confidence trading setups.
⯁ CONCLUSION
LR Volume Profile [ChartPrime] is a precision tool for traders who want to merge trend analysis with volume insight. By integrating linear regression trendlines with a clean and readable volume distribution, this indicator helps traders find price levels that matter the most—backed by volume, trend, and structure. Whether you're spotting high-volume nodes or gauging directional flow, this toolkit elevates your decision-making process with clarity and depth.
Mã nguồn mở
Theo đúng tinh thần TradingView, tác giả của tập lệnh này đã công bố nó dưới dạng mã nguồn mở, để các nhà giao dịch có thể xem xét và xác minh chức năng. Chúc mừng tác giả! Mặc dù bạn có thể sử dụng miễn phí, hãy nhớ rằng việc công bố lại mã phải tuân theo Nội quy.
Thông báo miễn trừ trách nhiệm
Thông tin và các ấn phẩm này không nhằm mục đích, và không cấu thành, lời khuyên hoặc khuyến nghị về tài chính, đầu tư, giao dịch hay các loại khác do TradingView cung cấp hoặc xác nhận. Đọc thêm tại Điều khoản Sử dụng.