PROTECTED SOURCE SCRIPT
Earnings X-Ray and Fundamentals Data:VSMarketTrend
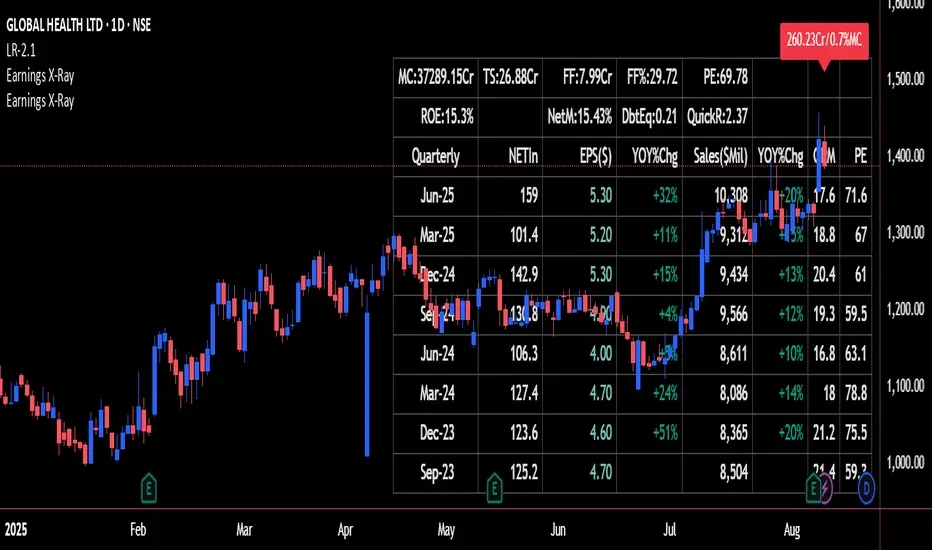
This indicator calculates essential financial metrics for stocks using TradingView's built-in functions and custom algorithms. The values are derived from fundamental data sources available on TradingView.
Key Output Metrics(YOY Basic Quaterly DATA)
MC (Market Cap): Company’s total market value (Price × Total Shares).
TS (Total Shares Outstanding): All shares (float + restricted) in circulation.
Sales: Annual revenue (TTM or latest fiscal year).
NETIn: Net income
P/E (Price-to-Earnings): Valuation ratio (Market Cap / Net Income or Price / EPS).
EPS (Earnings Per Share): Net income per share (Net Income / TS).
OPM (Operating Margin %): Core profitability (Operating Income / Revenue × 100).
Quick Ratio: Short-term liquidity ((Current Assets – Inventory) / Current Liabilities).
BVPS (Book Value Per Share): Equity per share (Shareholders’ Equity / TS).
PS (Price-to-Sales): Revenue-based valuation (Market Cap / Annual Revenue).
FCF (Free Cash Flow Per Share): Post-CapEx cash ((Operating Cash Flow – CapEx) / TS).
Data Sources & Methods
Uses TradingView’s request.financial() for income/balance sheet data (Revenue, EBITDA, etc.).
Fetches real-time metrics via request.security() (e.g., Shares Outstanding).
Normalizes data across timeframes (quarterly/annual).

Disclaimer
Not financial advice. Verify with official filings before trading.
Key Output Metrics(YOY Basic Quaterly DATA)
MC (Market Cap): Company’s total market value (Price × Total Shares).
TS (Total Shares Outstanding): All shares (float + restricted) in circulation.
Sales: Annual revenue (TTM or latest fiscal year).
NETIn: Net income
P/E (Price-to-Earnings): Valuation ratio (Market Cap / Net Income or Price / EPS).
EPS (Earnings Per Share): Net income per share (Net Income / TS).
OPM (Operating Margin %): Core profitability (Operating Income / Revenue × 100).
Quick Ratio: Short-term liquidity ((Current Assets – Inventory) / Current Liabilities).
BVPS (Book Value Per Share): Equity per share (Shareholders’ Equity / TS).
PS (Price-to-Sales): Revenue-based valuation (Market Cap / Annual Revenue).
FCF (Free Cash Flow Per Share): Post-CapEx cash ((Operating Cash Flow – CapEx) / TS).
Data Sources & Methods
Uses TradingView’s request.financial() for income/balance sheet data (Revenue, EBITDA, etc.).
Fetches real-time metrics via request.security() (e.g., Shares Outstanding).
Normalizes data across timeframes (quarterly/annual).
Disclaimer
Not financial advice. Verify with official filings before trading.
Mã được bảo vệ
Tập lệnh này được đăng dưới dạng mã nguồn đóng. Tuy nhiên, bạn có thể sử dụng tự do và không giới hạn – tìm hiểu thêm tại đây.
Thông báo miễn trừ trách nhiệm
Thông tin và các ấn phẩm này không nhằm mục đích, và không cấu thành, lời khuyên hoặc khuyến nghị về tài chính, đầu tư, giao dịch hay các loại khác do TradingView cung cấp hoặc xác nhận. Đọc thêm tại Điều khoản Sử dụng.