OPEN-SOURCE SCRIPT
Cập nhật Market Cap / Revenue Ratio
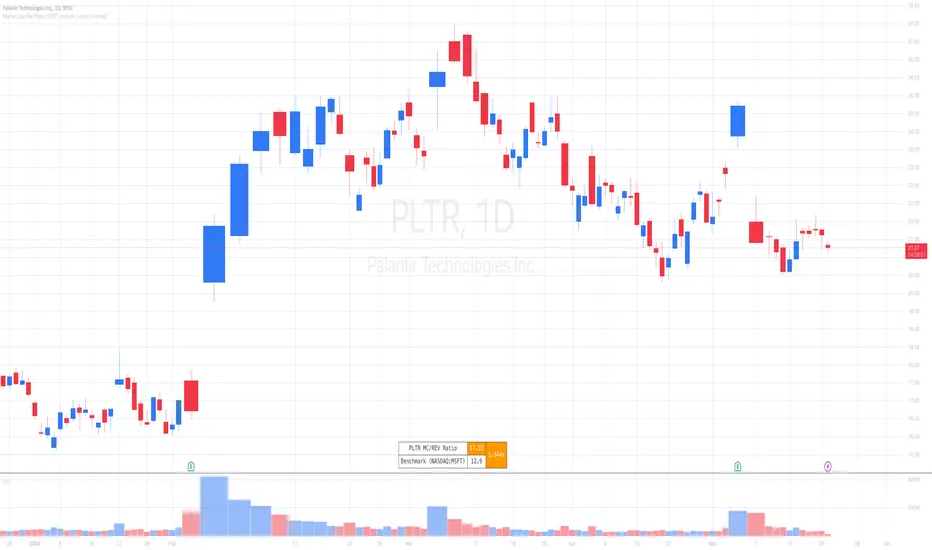
A variation of the P/S ratio, this script takes the future estimated revenue of the current stock versus it's Market Cap. It then compares the aforementioned Market Cap:Revenue ratio against a market bellwether's corresponding ratio (MSFT by default) to determine the following:
- Light green when the ratio is extremely low (Stock is very undervalued)
- Green when the ratio is low (Stock's multiple is lower by 20-50%)
- Blue when the ratio is close to the benchmark (Stock is fairly valued to benchmark multiple)
- Red when the ratio is high (Stock's mulitple is higher by 50% or more)
- Dark red when the ratio is extremely high (Stock is very overvalued)
CONFIGURABLE
- Full Table: Show the entire calculation table
- Minimalist: Go minimal and show only the ratio and color code
- Show Benchmark Multiple: Show the multiple ratio calculated between the current stock and the benchmark stock (MSFT by default)
NOTES
- When calculating the Market Cap, TradingView sometimes under-reports the number of shares and thus skews the Market Cap too low. This seems to happen for stocks with multiple share classes like GOOGL so be mindful that the data can be wrong for these kinds of stocks. You can check on this by going into the Indicator's Settings and select Show Full Table which will show the number of shares outstanding reported by TradingView.
- For certain stocks such as foreign ADRs, there won't be a future revenue estimate so the script will automatically use the Total Revenue for the most recent Quarter in these cases
Phát hành các Ghi chú
Code cleanup / added more comments. Chart update.Mã nguồn mở
Theo đúng tinh thần TradingView, tác giả của tập lệnh này đã công bố nó dưới dạng mã nguồn mở, để các nhà giao dịch có thể xem xét và xác minh chức năng. Chúc mừng tác giả! Mặc dù bạn có thể sử dụng miễn phí, hãy nhớ rằng việc công bố lại mã phải tuân theo Nội quy.
Thông báo miễn trừ trách nhiệm
Thông tin và các ấn phẩm này không nhằm mục đích, và không cấu thành, lời khuyên hoặc khuyến nghị về tài chính, đầu tư, giao dịch hay các loại khác do TradingView cung cấp hoặc xác nhận. Đọc thêm tại Điều khoản Sử dụng.
Mã nguồn mở
Theo đúng tinh thần TradingView, tác giả của tập lệnh này đã công bố nó dưới dạng mã nguồn mở, để các nhà giao dịch có thể xem xét và xác minh chức năng. Chúc mừng tác giả! Mặc dù bạn có thể sử dụng miễn phí, hãy nhớ rằng việc công bố lại mã phải tuân theo Nội quy.
Thông báo miễn trừ trách nhiệm
Thông tin và các ấn phẩm này không nhằm mục đích, và không cấu thành, lời khuyên hoặc khuyến nghị về tài chính, đầu tư, giao dịch hay các loại khác do TradingView cung cấp hoặc xác nhận. Đọc thêm tại Điều khoản Sử dụng.