PROTECTED SOURCE SCRIPT
Cập nhật Vector Candles - By Blockhead
What this script does:
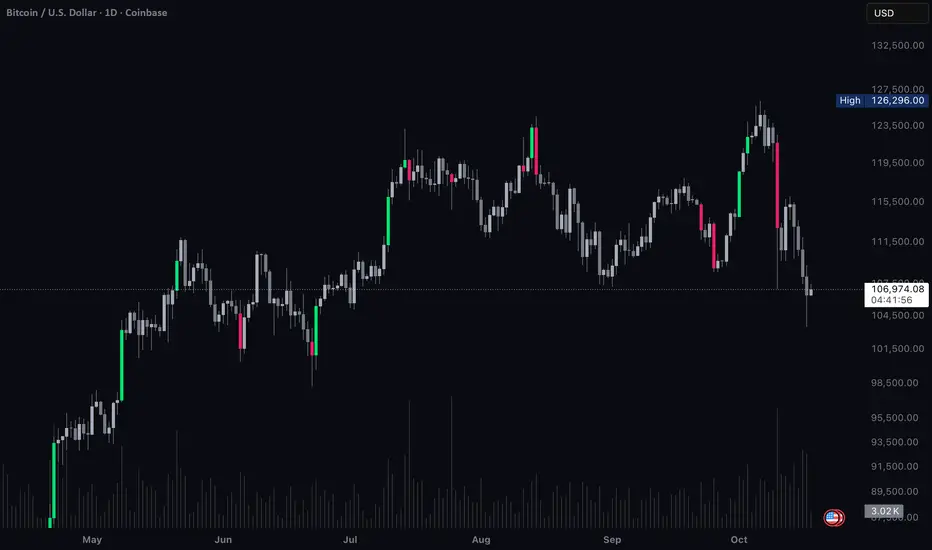
Vector Candles highlights moments of intense market participation by coloring “climax” candles — bars where trading activity surges beyond normal conditions. These colored candles make it easy to visualize bursts of liquidity, directional momentum, or exhaustion zones across any market.
⸻
How this script works:
The indicator scans each bar for abnormal behavior in volume and range expansion.
If volume exceeds 2× the 10-bar average or if volume × range reaches a short-term extreme, that candle is marked as a “climax” — lime for bullish momentum or red for bearish pressure.
This provides a clean, real-time visual of where institutional volume or aggressive participation enters the market.
⸻
How to use this script:
Apply Vector Candles to any chart to spot areas of heavy buying or selling interest.
Optionally, enable the “Override Chart Symbol” setting to pull data from a reference market (e.g., QQQ for tech stocks, DXY for gold, BTC index for altcoins).
This allows you to identify when a symbol’s move is part of a sector rotation, broader flow, or inverse correlation, rather than isolated price action.
⸻
What makes this script original:
Unlike traditional vector candle indicators, this version introduces a cross-symbol volume engine — letting you visualize climax activity from one market directly on another.
This unlocks a powerful new layer of contextual analysis, ideal for spotting rotations, correlation breaks, and macro-driven liquidity shifts in real time.
It’s not just about where momentum appears — it’s about where it originates.
Phát hành các Ghi chú
Updated screenshotMã được bảo vệ
Tập lệnh này được đăng dưới dạng mã nguồn đóng. Tuy nhiên, bạn có thể sử dụng tự do và không giới hạn – tìm hiểu thêm tại đây.
Thông báo miễn trừ trách nhiệm
Thông tin và các ấn phẩm này không nhằm mục đích, và không cấu thành, lời khuyên hoặc khuyến nghị về tài chính, đầu tư, giao dịch hay các loại khác do TradingView cung cấp hoặc xác nhận. Đọc thêm tại Điều khoản Sử dụng.
Mã được bảo vệ
Tập lệnh này được đăng dưới dạng mã nguồn đóng. Tuy nhiên, bạn có thể sử dụng tự do và không giới hạn – tìm hiểu thêm tại đây.
Thông báo miễn trừ trách nhiệm
Thông tin và các ấn phẩm này không nhằm mục đích, và không cấu thành, lời khuyên hoặc khuyến nghị về tài chính, đầu tư, giao dịch hay các loại khác do TradingView cung cấp hoặc xác nhận. Đọc thêm tại Điều khoản Sử dụng.