PROTECTED SOURCE SCRIPT
Skew Detector
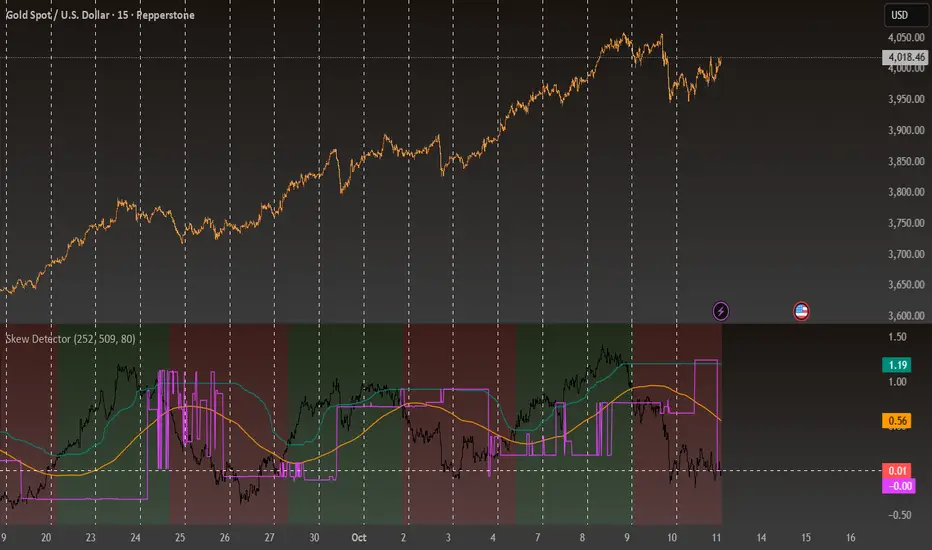
Skew Detector is a statistical bias analyzer designed to measure and visualize market asymmetry using range-based skewness.
It helps traders identify when price movements are stretching too far in one direction — signaling potential imbalance, exhaustion, or continuation bias in momentum.
The indicator computes three independent measures of skewness — mean, median, and mode — across a customizable lookback window. These are plotted as reference lines against a synthetic "skew candle" series, allowing you to visualize how current market skew compares to its historical distribution.
When the background turns green, it indicates that the market’s current skew is greater than all three reference measures — suggesting bullish dominance or upward distortion in price movement.
When it turns red, the opposite is true — signaling potential downside bias or negative skew.
Features
Measures mean, median, and mode of return-based skewness.
Highlights extreme bias conditions through dynamic background coloring.
Visualizes a synthetic skew candle series to track short-term fluctuations.
Fully customizable lookback length and histogram resolution.
Mã được bảo vệ
Tập lệnh này được đăng dưới dạng mã nguồn đóng. Tuy nhiên, bạn có thể tự do sử dụng tập lệnh mà không có bất kỳ hạn chế nào – tìm hiểu thêm tại đây.
Thông báo miễn trừ trách nhiệm
Thông tin và ấn phẩm không có nghĩa là và không cấu thành, tài chính, đầu tư, kinh doanh, hoặc các loại lời khuyên hoặc khuyến nghị khác được cung cấp hoặc xác nhận bởi TradingView. Đọc thêm trong Điều khoản sử dụng.