PROTECTED SOURCE SCRIPT
Price Action [SignalCave]
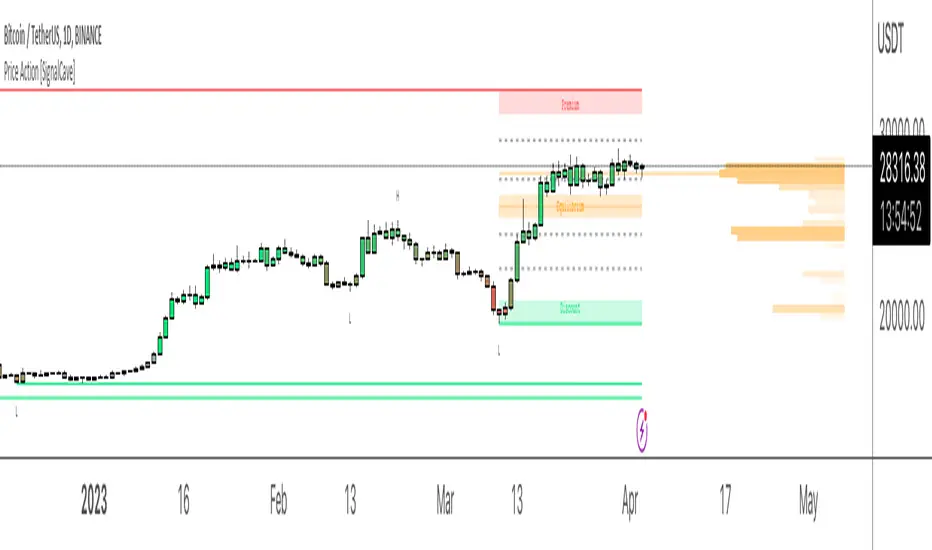
Liquidation prices are calculated with Higher Timeframe usage of "Williams Fractals" indicator.
Sell side liquidity levels are shown with "L" text and a green solid lines.
Buy side liquidity levels are shown with "H" text and a red solid lines.
Premium and Discount zones are determined with latest untested buy/sell liquidity levels.
"Premium" means the asset price is overvalued, "Discount" means the asset is undervalued.
Once price hits any active liquidity level, "Premium and Discount" zone will be recalculated.
Premium and Discount have "Equilibrium" area which is center area of the whole zone.
Extra Support & Resistance levels calculation are based on Fibonacci. Levels are 23.6%, 38.2%, 61.8% and 78.6%.
Bars are painted based on asset's momentum. The asset momentum is calculated by the RSI and ADX indicators.
Volume profile shows trade activity during the "Premium and Discount" zone.
Mã được bảo vệ
Tập lệnh này được đăng dưới dạng mã nguồn đóng. Tuy nhiên, bạn có thể sử dụng tự do và không giới hạn – tìm hiểu thêm tại đây.
Pine Script Code Generator:
getpinescript.com/
Optimize Your TradingView Strategies:
pinetune.app
Trading Simulation Game:
Dare2Trade.com
Pine Script Job Proposals:
t.me/kriswaters
getpinescript.com/
Optimize Your TradingView Strategies:
pinetune.app
Trading Simulation Game:
Dare2Trade.com
Pine Script Job Proposals:
t.me/kriswaters
Thông báo miễn trừ trách nhiệm
Thông tin và các ấn phẩm này không nhằm mục đích, và không cấu thành, lời khuyên hoặc khuyến nghị về tài chính, đầu tư, giao dịch hay các loại khác do TradingView cung cấp hoặc xác nhận. Đọc thêm tại Điều khoản Sử dụng.