PROTECTED SOURCE SCRIPT
[Max] Volume Entropy Divergence Heatmap
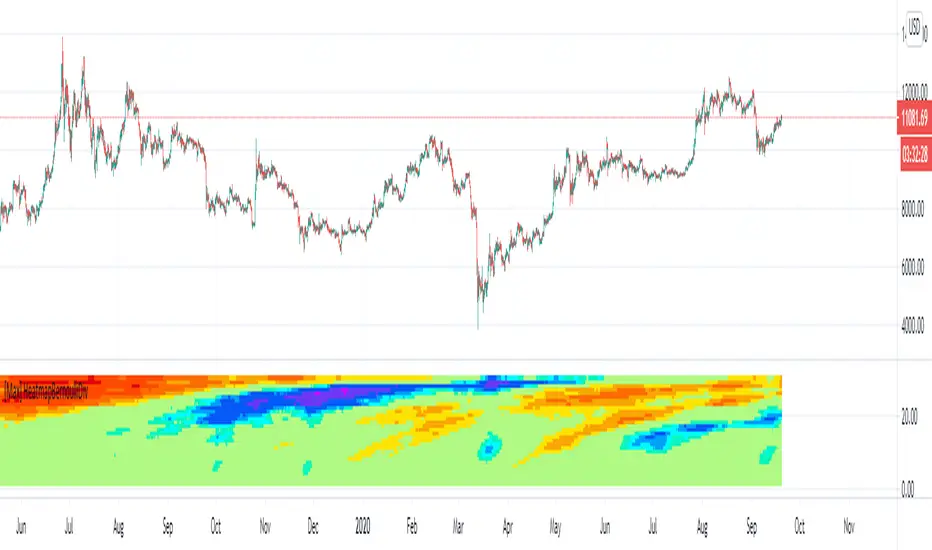
A divergence between volume and price indicator, based on custom filter function.
Each lines represent a length on wich the divergence is calculated. It goes to 60 len a the base to 2000 at the high. ( You have to decrease the timeframe if your looking on a new chart).
Colors represent a level of the oscillator who is calculated for each lengths.
What can you find, reversals, confirmation of continuation, divergences between volume and price,.. (if you find other usages I will be happy to hear it and share the code).
I recommand to be attentive to lower timeframes and confirm with higher ones and be attentive between different kind of clouds there is.
You are in charge to figure out how to use it, if you have some doubts on something you can DM me but I will not teach my way to use it.
It provide for me nice transformations, nice enough to share this indicator in private.
Big thanks to @midtownsk8rguy for the heatmap color function.
Have a nice daytrading all !
Mã được bảo vệ
Tập lệnh này được đăng dưới dạng mã nguồn đóng. Tuy nhiên, bạn có thể sử dụng tự do và không giới hạn – tìm hiểu thêm tại đây.
Thông báo miễn trừ trách nhiệm
Thông tin và các ấn phẩm này không nhằm mục đích, và không cấu thành, lời khuyên hoặc khuyến nghị về tài chính, đầu tư, giao dịch hay các loại khác do TradingView cung cấp hoặc xác nhận. Đọc thêm tại Điều khoản Sử dụng.