PROTECTED SOURCE SCRIPT
Cập nhật PpSignal Ichimoku Kinko Hyo
What is the Ichimoku Kinko Hyo?
The Ichimoku Kinko Hyo, or Ichimoku for short, is a technical indicator that is used to gauge momentum along with future areas of support and resistance. The all-in-one technical indicator is comprised of five lines called the tenkan-sen, kijun-sen, senkou span A, senkou span B and chikou span.
Understanding Ichimoku Kinko Hyo
The Ichimoku Kinko Hyo indicator was originally developed by a Japanese newspaper writer to combine various technical strategies into a single indicator that could be easily implemented and interpreted. In Japanese, "ichimoku" translates to "one look," meaning traders only have to take one look at the chart to determine momentum, support, and resistance.
Ichimoku may look very complicated to novice traders that haven't seen it before, but the complexity quickly disappears with an understanding of what the various lines mean and why they are used.
The Ichimoku indicator is best used in conjunction with other forms of technical analysis despite its goal of being an all-in-one indicator.
Ichimoku Kinko Hyo Interpretation
There are five key components to the Ichimoku indicator:
Tenkan-sen: The tenkan-sen, or conversion line, is calculated by adding the highest high and the highest low over the past nine periods and then dividing the result by two. The resulting line represents a key support and resistance level, as well as a signal line for reversals.
Kijun-sen: The kijun-sen, or base line, is calculated by adding the highest high and the lowest low over the past 26 periods and dividing the result by two. The resulting line represents a key support and resistance level, a confirmation of a trend change, and can be used as a trailing stop-loss point.
Senkou Span A: The senkou span A, or leading span A, is calculated by adding the tenkan-sen and the kijun-sen, dividing the result by two, and then plotting the result 26 periods ahead. The resulting line forms one edge of the kumo - or cloud - that's used to identify future areas of support and resistance.
Senkou Span B: The senkou span B, or leading span B, is calculated by adding the highest high and the lowest low over the past 52 periods, dividing it by two, and then plotting the result 26 periods ahead. The resulting line forms the other edge of the kumo that's used to identify future areas of support and resistance.
Chikou Span: The chikou span, or lagging span, is the current period's closing price plotted 26 days back on the chart. This line is used to show possible areas of support and resistance.
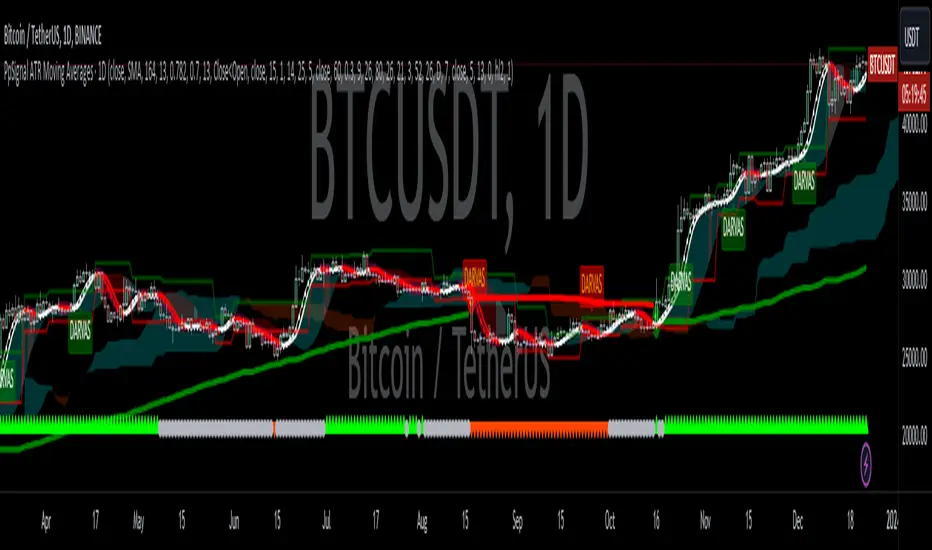
Example of an Ichimoku Kinko Hyo Chart
The following is an example of an Ichimoku indicator plotted on a chart:
Indicator component
Alarm
Have alarm when price and Chicouspan cross Kumo cloud.
Have Alarm when tekn Sen 9 cross Kijusen 26.
Have Hiken ashi buy and sell alarm
Other tools
Mtf cloud.
The Ichimoku Kinko Hyo, or Ichimoku for short, is a technical indicator that is used to gauge momentum along with future areas of support and resistance. The all-in-one technical indicator is comprised of five lines called the tenkan-sen, kijun-sen, senkou span A, senkou span B and chikou span.
Understanding Ichimoku Kinko Hyo
The Ichimoku Kinko Hyo indicator was originally developed by a Japanese newspaper writer to combine various technical strategies into a single indicator that could be easily implemented and interpreted. In Japanese, "ichimoku" translates to "one look," meaning traders only have to take one look at the chart to determine momentum, support, and resistance.
Ichimoku may look very complicated to novice traders that haven't seen it before, but the complexity quickly disappears with an understanding of what the various lines mean and why they are used.
The Ichimoku indicator is best used in conjunction with other forms of technical analysis despite its goal of being an all-in-one indicator.
Ichimoku Kinko Hyo Interpretation
There are five key components to the Ichimoku indicator:
Tenkan-sen: The tenkan-sen, or conversion line, is calculated by adding the highest high and the highest low over the past nine periods and then dividing the result by two. The resulting line represents a key support and resistance level, as well as a signal line for reversals.
Kijun-sen: The kijun-sen, or base line, is calculated by adding the highest high and the lowest low over the past 26 periods and dividing the result by two. The resulting line represents a key support and resistance level, a confirmation of a trend change, and can be used as a trailing stop-loss point.
Senkou Span A: The senkou span A, or leading span A, is calculated by adding the tenkan-sen and the kijun-sen, dividing the result by two, and then plotting the result 26 periods ahead. The resulting line forms one edge of the kumo - or cloud - that's used to identify future areas of support and resistance.
Senkou Span B: The senkou span B, or leading span B, is calculated by adding the highest high and the lowest low over the past 52 periods, dividing it by two, and then plotting the result 26 periods ahead. The resulting line forms the other edge of the kumo that's used to identify future areas of support and resistance.
Chikou Span: The chikou span, or lagging span, is the current period's closing price plotted 26 days back on the chart. This line is used to show possible areas of support and resistance.
Example of an Ichimoku Kinko Hyo Chart
The following is an example of an Ichimoku indicator plotted on a chart:
Indicator component
Alarm
Have alarm when price and Chicouspan cross Kumo cloud.
Have Alarm when tekn Sen 9 cross Kijusen 26.
Have Hiken ashi buy and sell alarm
Other tools
Mtf cloud.
Phát hành các Ghi chú
Added alarm Phát hành các Ghi chú
We added ATR Move Average, Darvas box and bb 13 1Mã được bảo vệ
Tập lệnh này được đăng dưới dạng mã nguồn đóng. Tuy nhiên, bạn có thể sử dụng tự do và không giới hạn – tìm hiểu thêm tại đây.
Thông báo miễn trừ trách nhiệm
Thông tin và các ấn phẩm này không nhằm mục đích, và không cấu thành, lời khuyên hoặc khuyến nghị về tài chính, đầu tư, giao dịch hay các loại khác do TradingView cung cấp hoặc xác nhận. Đọc thêm tại Điều khoản Sử dụng.
Mã được bảo vệ
Tập lệnh này được đăng dưới dạng mã nguồn đóng. Tuy nhiên, bạn có thể sử dụng tự do và không giới hạn – tìm hiểu thêm tại đây.
Thông báo miễn trừ trách nhiệm
Thông tin và các ấn phẩm này không nhằm mục đích, và không cấu thành, lời khuyên hoặc khuyến nghị về tài chính, đầu tư, giao dịch hay các loại khác do TradingView cung cấp hoặc xác nhận. Đọc thêm tại Điều khoản Sử dụng.