PROTECTED SOURCE SCRIPT
Max Price Range Deviation
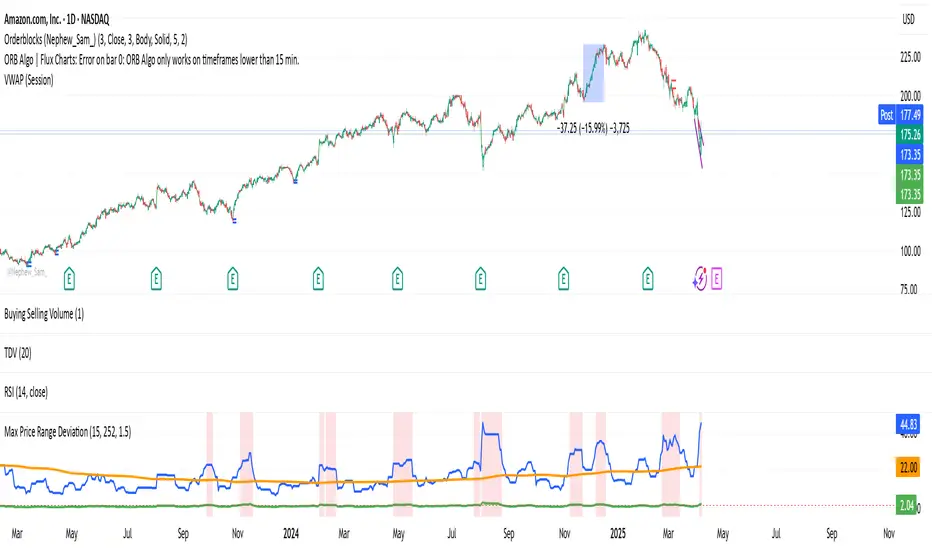
This indicator measures how far a stock has moved in recent days relative to its typical movement over a longer period.
🧠 What it does:
Calculates the absolute price range (highest high − lowest low) over a recent number of days.
Compares this recent range to the average max range from rolling windows of the same size over a longer lookback period.
Plots:
✅ Recent Range (blue line)
✅ Average Historical Range (orange line)
✅ Ratio of Recent to Average (green line)
Highlights when recent movement is significantly higher than normal using a configurable threshold.
⚙️ Inputs:
Recent Period (days): Number of days to calculate the current price move.
Lookback Period (days): Number of days used to calculate the average historical range.
High Move Threshold (x avg): If the recent move exceeds this multiple of average, it's flagged.
🛠️ Use Cases:
Spot unusually large price swings.
Identify good opportunities to sell out-of-the-money options (e.g., covered calls or credit spreads) when moves are extended.
Avoid chasing late-stage breakouts.
Mã được bảo vệ
Tập lệnh này được đăng dưới dạng mã nguồn đóng. Tuy nhiên, bạn có thể sử dụng tự do và không giới hạn – tìm hiểu thêm tại đây.
Thông báo miễn trừ trách nhiệm
Thông tin và các ấn phẩm này không nhằm mục đích, và không cấu thành, lời khuyên hoặc khuyến nghị về tài chính, đầu tư, giao dịch hay các loại khác do TradingView cung cấp hoặc xác nhận. Đọc thêm tại Điều khoản Sử dụng.