OPEN-SOURCE SCRIPT
Time Profile [QuantVue]

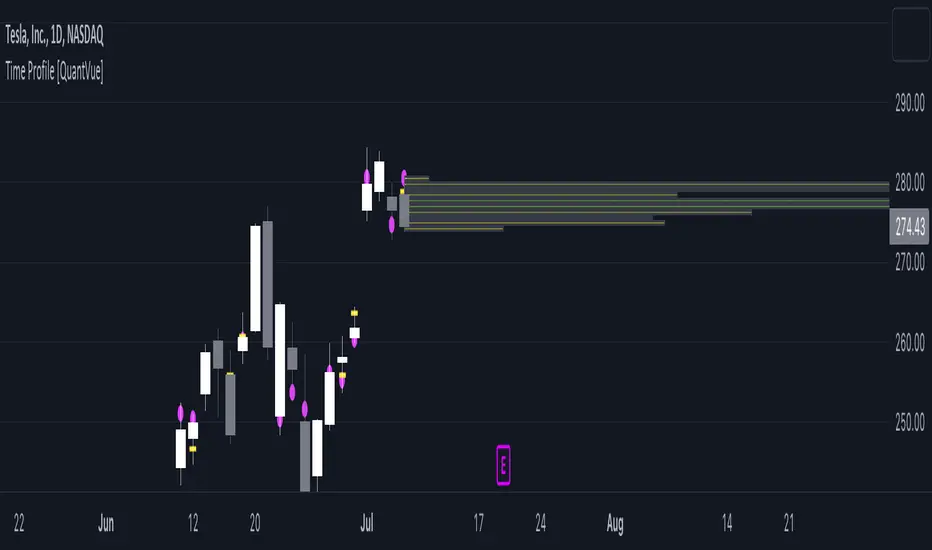
The Time Profile indicator provides traders with a comprehensive view of volume and time-based price activity. The indicator combines two essential components into one indicator: the volume profile and the time profile.
The volume profile represents the distribution of trading volume at different price levels over a specified period and is displayed as a circle on the chart.
It provides a visual representation of where the majority of trading volume occurred and often highlights significant support and resistance levels. The volume profile is calculated as the closing price of the highest volume intraday bar, based on the user selected lower time frame.
On the other hand, the time profile focuses on analyzing the time spent at certain price levels. The indicator divides the current bars range into 10 blocks and counts the number of user selected lower time frame closes within each time block.
The block with the most lower time frame closes in it is deemed the time point of control. Traders can use this information to identify time blocks where price movement was most significant.
The time profile is drawn on the Y axis of the current bar to allow for an easy visualization of where price spent most of its time. Historical time profiles are also noted on previous bars with a dash marking the level.
The Time Profile indicator offers several customization options. Traders can adjust the timeframe for the lower time frame data, decide whether to display the time profile, and customize colors for visual clarity.
Additionally, traders can choose to highlight instances where the Volume POC and Time POC align, indicating a strong concentration of volume and price activity.
Don't hesitate to reach out with any questions or concerns.
We hope you enjoy!
Cheers.
Mã nguồn mở
Theo đúng tinh thần TradingView, tác giả của tập lệnh này đã công bố nó dưới dạng mã nguồn mở, để các nhà giao dịch có thể xem xét và xác minh chức năng. Chúc mừng tác giả! Mặc dù bạn có thể sử dụng miễn phí, hãy nhớ rằng việc công bố lại mã phải tuân theo Nội quy.
Get Access to the exclusive QuantVue indicators: quantvue.io/
Join thousands of traders in our Free Discord: discord.gg/tC7u7magU3
Join thousands of traders in our Free Discord: discord.gg/tC7u7magU3
Thông báo miễn trừ trách nhiệm
Thông tin và các ấn phẩm này không nhằm mục đích, và không cấu thành, lời khuyên hoặc khuyến nghị về tài chính, đầu tư, giao dịch hay các loại khác do TradingView cung cấp hoặc xác nhận. Đọc thêm tại Điều khoản Sử dụng.