PROTECTED SOURCE SCRIPT
OB EMA Fibo Tunnel
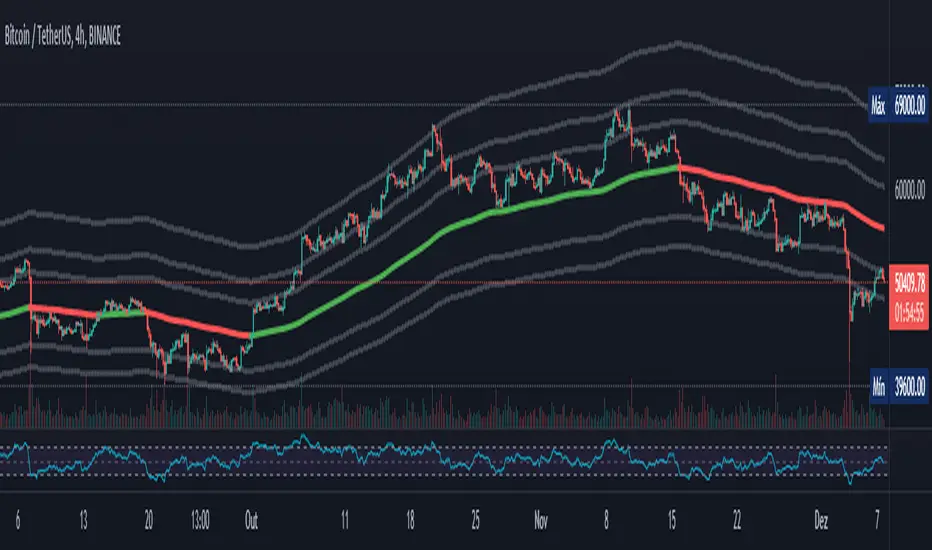
This indicator plots a base EMA and then plot many lines above and below according to the Fibonacci levels, creating a tunnel where it is possible to see the price respecting some levels.
It is similar the concept of Vegas Tunnel, but with my numbers.
The Base EMA is 26 for daily charts and 8 for Weekly charts. The smaller timeframes use a variation of 26, like 26*4 for 4h charts.
It is also possible to choose if you want to color candle bars and what levels of Fibo lines you want to see. I created that to have a clean chart.
*** To enable the colored candles, you should choose the visual order and move to top!
Please leave a comment if you liked and if you have any suggestion.
Mã được bảo vệ
Tập lệnh này được đăng dưới dạng mã nguồn đóng. Tuy nhiên, bạn có thể sử dụng tự do và không giới hạn – tìm hiểu thêm tại đây.
Thông báo miễn trừ trách nhiệm
Thông tin và các ấn phẩm này không nhằm mục đích, và không cấu thành, lời khuyên hoặc khuyến nghị về tài chính, đầu tư, giao dịch hay các loại khác do TradingView cung cấp hoặc xác nhận. Đọc thêm tại Điều khoản Sử dụng.