PROTECTED SOURCE SCRIPT
Crypto Neo - Blockchain Momentum (BTC Settings)
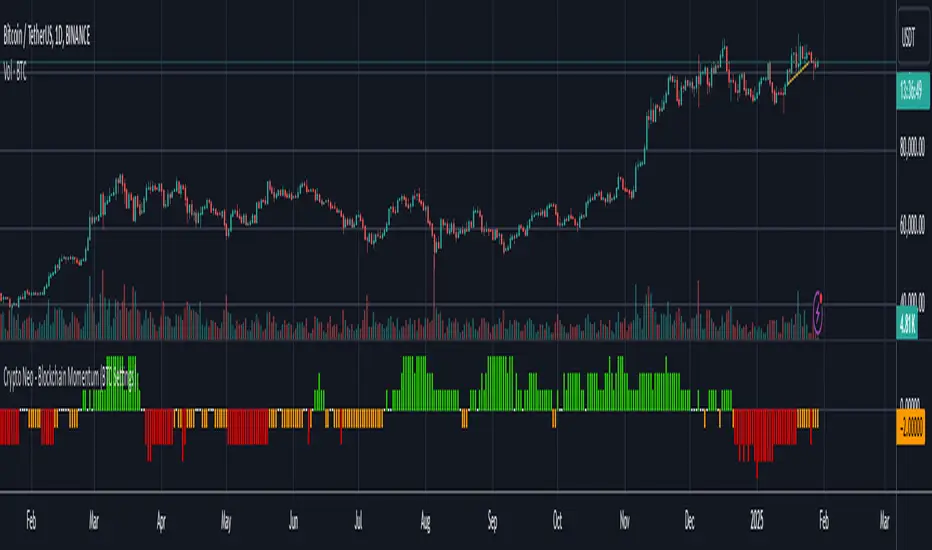
The Crypto Neo - Blockchain Momentum indicator analyzes Bitcoin’s on-chain activity to gauge bullish or bearish trends. It combines multiple on-chain metrics and applies different moving average strategies to assess Bitcoin’s momentum.
This indicator is designed to track key blockchain data sources, such as:
It processes these inputs using various Moving Average (MA) types, including SMA, EMA, DMA, to generate a Bullish Momentum Score, which is visually displayed on the chart.
How to Use:
Important Notes
* This indicator does not generate trading signals but helps interpret blockchain trends for informed decision-making.
* Since it relies on daily on-chain data, it is best used on the 1D timeframe for accurate readings.
* Real-time calculations may vary slightly due to different bar update behaviors.
This indicator is very useful to confirm market turns early. Here are a few an example setups:
1. Back in 2019 on chain metrics started trending up after the market had dumped signaling a very good opportunity to buy.

2. During the 2021 bull market. When the market was forming a top, the on chain metrics started trending down indicating a risk to the downside.

This indicator is designed to track key blockchain data sources, such as:
- Hash Rate
- Active Addresses
- Transactions per Second
- New Addresses
- Trader Behavior
- Long-Term Holders (Cruisers)
- Money Flow In/Out
- Large Transactions Count
It processes these inputs using various Moving Average (MA) types, including SMA, EMA, DMA, to generate a Bullish Momentum Score, which is visually displayed on the chart.
How to Use:
- Select MA Type – Choose between SMA, EMA, MIXMA, or DMA to determine how moving averages are applied.
- Set MA Lengths – Adjust MA1 Length and MA2 Length to define short-term vs. long-term trend comparison.
- Customize Data Sources – Select different on-chain metrics for the indicator to analyze.
- Interpret the Bullish Momentum Score:
🟢 Green (Strong Bullish Momentum) – Bullish on-chain signals dominate.
🟡 Yellow (Moderate Bullish Momentum) – Weak bullish trend forming.
⚪ White (Neutral) – No clear trend.
🟠 Orange (Moderate Bearish Momentum) – Weak bearish signals emerging.
🔴 Red (Strong Bearish Momentum) – Bearish on-chain signals dominate.
Important Notes
* This indicator does not generate trading signals but helps interpret blockchain trends for informed decision-making.
* Since it relies on daily on-chain data, it is best used on the 1D timeframe for accurate readings.
* Real-time calculations may vary slightly due to different bar update behaviors.
This indicator is very useful to confirm market turns early. Here are a few an example setups:
1. Back in 2019 on chain metrics started trending up after the market had dumped signaling a very good opportunity to buy.
2. During the 2021 bull market. When the market was forming a top, the on chain metrics started trending down indicating a risk to the downside.
Mã được bảo vệ
Tập lệnh này được đăng dưới dạng mã nguồn đóng. Tuy nhiên, bạn có thể sử dụng tự do và không giới hạn – tìm hiểu thêm tại đây.
Crypto Neo
📈 Algo Strategies | Market Signals
🔍 Data-Driven Edge for Traders
⚡ Developing high-performance trading systems
📢 Telegram 👉 t.me/cryptoNeo0x
📈 Algo Strategies | Market Signals
🔍 Data-Driven Edge for Traders
⚡ Developing high-performance trading systems
📢 Telegram 👉 t.me/cryptoNeo0x
Thông báo miễn trừ trách nhiệm
Thông tin và các ấn phẩm này không nhằm mục đích, và không cấu thành, lời khuyên hoặc khuyến nghị về tài chính, đầu tư, giao dịch hay các loại khác do TradingView cung cấp hoặc xác nhận. Đọc thêm tại Điều khoản Sử dụng.