PROTECTED SOURCE SCRIPT
Money Flow Profile
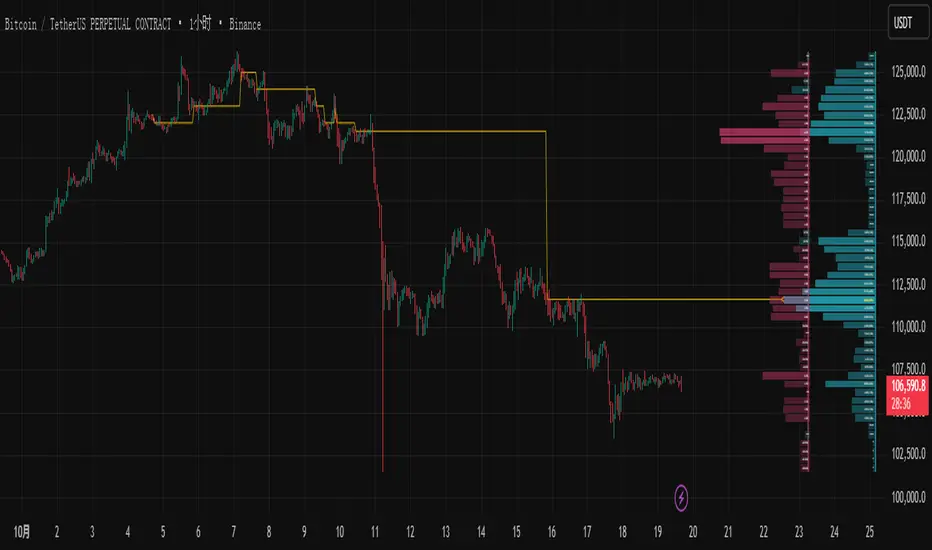
**Delta Profile** displays the difference in buying and selling pressure at specific price levels:
1. **Blue Zones**: Indicates price ranges with strong buying power. Displayed when buying power exceeds selling power.
2. **Red Zones**: Indicates price ranges with strong selling power. Displayed when selling power exceeds buying power.
3. **Calculation Method**: Determines the relative buying and selling power of each price range based on your selected "Polarity Method" (Kanabi Polarity or Kanabi Buy/Sell Pressure).
This histogram helps you identify price levels with strong buying or selling pressure, thereby assessing market sentiment and potential turning points.
## Money Flow Profile
The histogram on the right displays the **Money Flow Profile**, which represents the total money flow at a specific price level:
1. **Normalized Display**: The length of each price level is expressed as a percentage of the highest volume level for easier comparison.
2. **Color Gradient**: Uses different shades of color based on trading volume, with higher volume indicating darker colors.
3. **Number Display**: If enabled, displays the specific Money Flow value and percentage.
This histogram helps you identify price levels with the most trading activity; these levels often serve as important support or resistance levels.
## Combining the Two
- When strong buying (blue) is displayed on the left and high volume is displayed on the right, it indicates strong buying support at that price level.
- When strong selling (red) is displayed on the left and high volume is displayed on the right, it indicates strong selling pressure at that price level.
- Combining high volume points (on the right) with shifts in buying and selling power (color change on the left) helps identify potential price turning points.
This combined analysis method allows you to simultaneously understand market activity and the balance of buying and selling power, providing a more comprehensive basis for trading decisions.
Mã được bảo vệ
Tập lệnh này được đăng dưới dạng mã nguồn đóng. Tuy nhiên, bạn có thể tự do sử dụng tập lệnh mà không có bất kỳ hạn chế nào – tìm hiểu thêm tại đây.
Thông báo miễn trừ trách nhiệm
Thông tin và ấn phẩm không có nghĩa là và không cấu thành, tài chính, đầu tư, kinh doanh, hoặc các loại lời khuyên hoặc khuyến nghị khác được cung cấp hoặc xác nhận bởi TradingView. Đọc thêm trong Điều khoản sử dụng.