OPEN-SOURCE SCRIPT
Quarterly Rolling VWAP
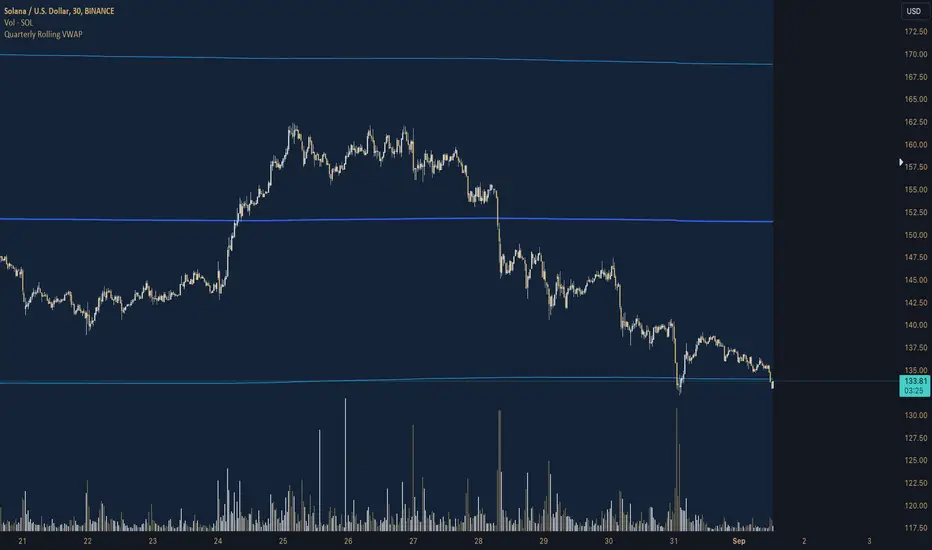
# Quarterly Rolling VWAP Indicator
This custom indicator calculates and displays a Volume-Weighted Average Price (VWAP) that resets at the beginning of each quarter, providing traders with a medium-term perspective on price action relative to trading volume.
## Key Features:
1. **Quarterly Reset**: The VWAP calculation automatically resets at the beginning of each quarter, allowing for a rolling analysis that adapts to changing market conditions.
2. **Standard Deviation Bands**: The indicator includes two sets of bands based on standard deviations from the VWAP, helping to identify potential support and resistance levels.
3. **Customizable Appearance**: Users can adjust the colors of the VWAP line and bands, as well as control the visibility and transparency of the bands.
4. **Flexible Band Multipliers**: The distance of the bands from the VWAP can be adjusted using customizable multipliers.
## Indicator Logic:
1. **Quarterly Detection**:
- The script uses a function `isNewQuarter()` to determine the start of a new quarter.
- It calculates the timestamp for the start of the current quarter and checks for changes in this value.
2. **VWAP Calculation**:
- The `calcVWAP()` function computes the Volume-Weighted Average Price.
- It maintains running sums of price * volume and volume, which reset at the start of each quarter.
- The VWAP is calculated as the ratio of these sums.
3. **Standard Deviation Calculation**:
- The `calcStdDev()` function computes the standard deviation of price from the VWAP.
- It uses a similar approach to VWAP, maintaining running sums that reset quarterly.
4. **Band Calculation**:
- Two sets of bands are calculated using the VWAP, standard deviation, and user-defined multipliers.
- Upper and lower bands are plotted at 1x and 2x the standard deviation by default, but these are customizable.
5. **Plotting**:
- The main VWAP line is plotted with user-defined color and width.
- Bands are plotted conditionally based on user preference.
- The area between bands is filled with a semi-transparent color for better visualization.
## Trading Applications:
- **Medium-Term Trend Analysis**: The quarterly VWAP provides a broader perspective on price trends compared to daily or weekly VWAPs.
- **Support and Resistance**: The VWAP line and bands can act as dynamic support and resistance levels.
- **Mean Reversion Strategies**: Traders can look for potential reversals when price reaches the outer bands.
- **Volatility Assessment**: The width of the bands gives an indication of recent price volatility relative to volume.
- **Quarter-over-Quarter Comparison**: By resetting each quarter, the indicator allows for easy comparison of price action across different quarters.
This Quarterly Rolling VWAP indicator is particularly useful for traders focusing on medium-term strategies or those who want to incorporate a broader market context into their analysis. It combines the power of volume-weighted pricing with a quarterly perspective, offering a unique tool for technical analysis
Mã nguồn mở
Theo đúng tinh thần TradingView, tác giả của tập lệnh này đã công bố nó dưới dạng mã nguồn mở, để các nhà giao dịch có thể xem xét và xác minh chức năng. Chúc mừng tác giả! Mặc dù bạn có thể sử dụng miễn phí, hãy nhớ rằng việc công bố lại mã phải tuân theo Nội quy.
Thông báo miễn trừ trách nhiệm
Thông tin và các ấn phẩm này không nhằm mục đích, và không cấu thành, lời khuyên hoặc khuyến nghị về tài chính, đầu tư, giao dịch hay các loại khác do TradingView cung cấp hoặc xác nhận. Đọc thêm tại Điều khoản Sử dụng.