PROTECTED SOURCE SCRIPT
Cập nhật BIAS RSI STOCH MACD Display
simple but effective to prevent chart clutter.
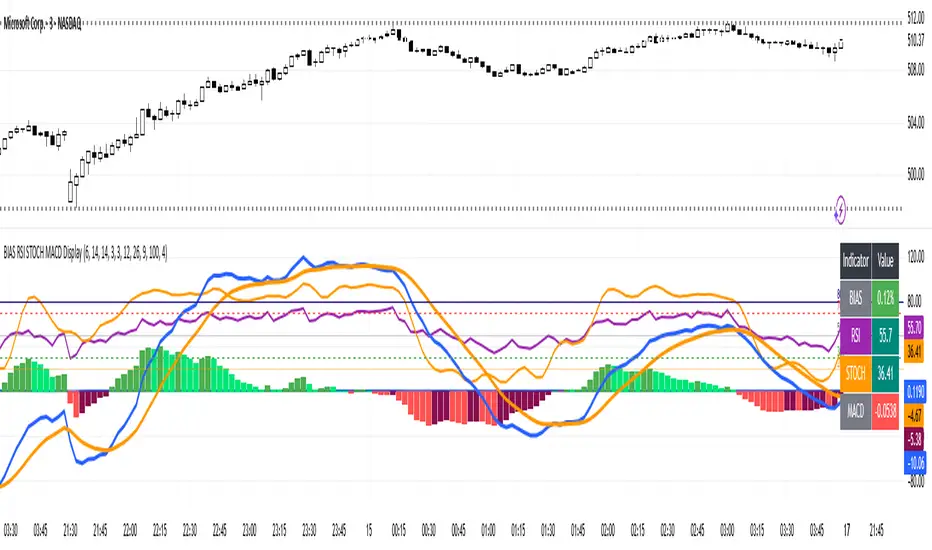
Hi Traders! Today I’m showing you a **custom indicator** that combines **BIAS, RSI, Stochastic, and MACD** in one easy-to-read panel. Let’s break it down:
1️⃣ **BIAS** – Shows how far the price is from its moving average.
* Positive BIAS → price is above the average.
* Negative BIAS → price is below the average.
2️⃣ **RSI (Relative Strength Index)** – Measures momentum.
* Above 70 → overbought
* Below 30 → oversold
* **50 line added** → midpoint for trend direction
3️⃣ **Stochastic (STOCH)** – Confirms momentum like RSI.
* Above 80 → overbought
* Below 20 → oversold
4️⃣ **MACD (Moving Average Convergence Divergence)** – Shows trend and momentum.
* Histogram colors indicate strength
* Lines show trend direction
5️⃣ **Visual Table** – On the top right, you can see all current indicator values at a glance, with color coding for easy interpretation.
6️⃣ **Plots & Levels** –
* BIAS, RSI, Stoch are plotted clearly
* RSI has **midline at 50** for trend reference
* Standard overbought/oversold levels highlighted
✅ **How to Use:**
* Look for RSI or Stoch crossing midline or extreme levels for potential entries.
* Check MACD histogram and lines for confirmation of trend strength.
* Use BIAS to see if price is stretched from the moving average.
This indicator is perfect for **momentum, trend, and mean-reversion traders**, giving multiple signals in one pane without clutter.
---
Phát hành các Ghi chú
uypdateMã được bảo vệ
Tập lệnh này được đăng dưới dạng mã nguồn đóng. Tuy nhiên, bạn có thể sử dụng tự do và không giới hạn – tìm hiểu thêm tại đây.
Thông báo miễn trừ trách nhiệm
Thông tin và các ấn phẩm này không nhằm mục đích, và không cấu thành, lời khuyên hoặc khuyến nghị về tài chính, đầu tư, giao dịch hay các loại khác do TradingView cung cấp hoặc xác nhận. Đọc thêm tại Điều khoản Sử dụng.
Mã được bảo vệ
Tập lệnh này được đăng dưới dạng mã nguồn đóng. Tuy nhiên, bạn có thể sử dụng tự do và không giới hạn – tìm hiểu thêm tại đây.
Thông báo miễn trừ trách nhiệm
Thông tin và các ấn phẩm này không nhằm mục đích, và không cấu thành, lời khuyên hoặc khuyến nghị về tài chính, đầu tư, giao dịch hay các loại khác do TradingView cung cấp hoặc xác nhận. Đọc thêm tại Điều khoản Sử dụng.