OPEN-SOURCE SCRIPT
Sector Momentum

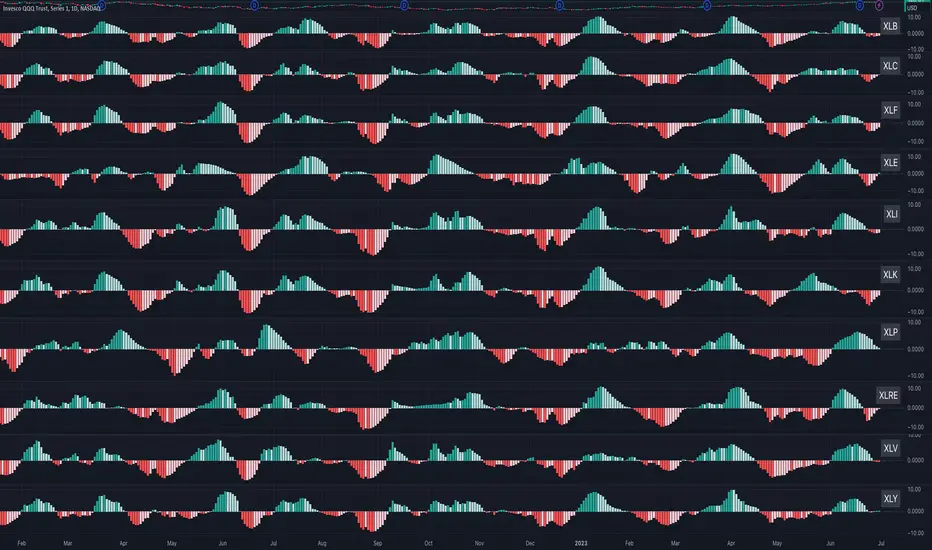
This indicator shows the momentum of a market sector. Under the hood, it's the MACD of the number of stocks above their 20 SMA in a specific sectors. The best insight it gives is to tell if the market is doing a sector rotation or having a full blown correction.
Users have the options to choose a specific sector out of the 11 sectors:
XLB, XLC, XLE, XLF, XLI, XLK, XLP, XLRE, XLU, XLV, XLY or show all them them by adding multiple indicators.
Use this indicator similar to MACD to look for momentum acceleration, deceleration and turn in a sector. More importantly, users can open up the indicator for all sectors and then compare between each.
Examples:
1. When we see momentum slows down in XLP and turn of XLK, it's a sign of sector rotation from consumer staple to tech. Money is going from defensive to riskier assets. Market is leaning towards risk-on mode. Stocks in tech have higher probability to outperform those in consumer staple.
2. When we see momentum subside across all sectors all at once or one by one, particularly both XLP, XLK/XLY, we'd expect market breadth is taking a hit across all sectors. This is not a sector rotation. A short to mid term market correction or drawdown is very likely.
Mã nguồn mở
Theo đúng tinh thần TradingView, tác giả của tập lệnh này đã công bố nó dưới dạng mã nguồn mở, để các nhà giao dịch có thể xem xét và xác minh chức năng. Chúc mừng tác giả! Mặc dù bạn có thể sử dụng miễn phí, hãy nhớ rằng việc công bố lại mã phải tuân theo Nội quy.
Thông báo miễn trừ trách nhiệm
Thông tin và các ấn phẩm này không nhằm mục đích, và không cấu thành, lời khuyên hoặc khuyến nghị về tài chính, đầu tư, giao dịch hay các loại khác do TradingView cung cấp hoặc xác nhận. Đọc thêm tại Điều khoản Sử dụng.