PROTECTED SOURCE SCRIPT
MATRIX Flow Chart V.3
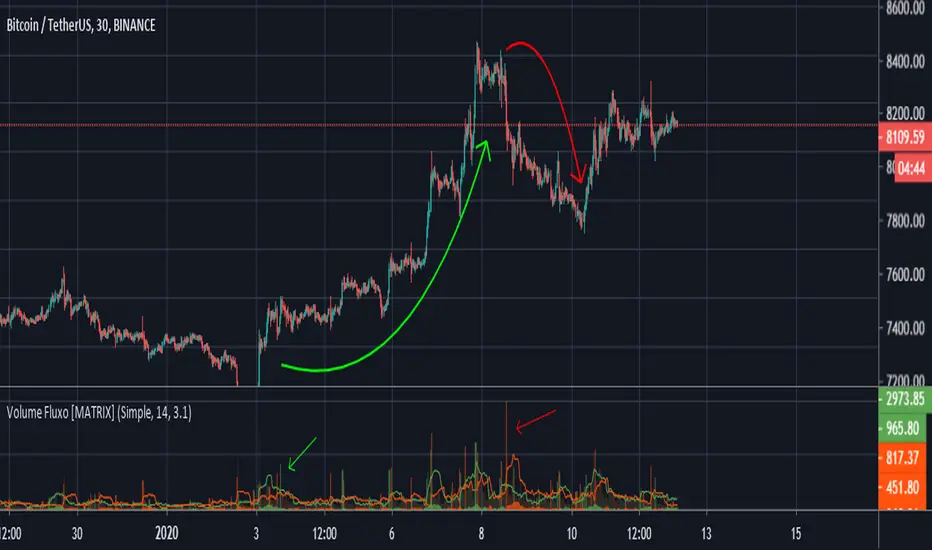
DepthHouse Volume Flow indicator is used to help determine trend direction strictly based on Negative and Positive volume data.
How to Read:
- Moving Average crossovers are used to help determine a possible trend change or retracement.
- The area cloud on the bottom is calculated by the difference of the moving averages. This could be used to help determine the trending volume strength.
- Bright colored volume bars are large volume spikes calculated by the x factor in the options.
Other changes:
- DepthHouse is going open source with numerous of its indicators. This is only one of many!
- Volume is now displayed without being altered for calculations.
O indicador de fluxo de volume DepthHouse é usado para ajudar a determinar a direção da tendência estritamente com base nos dados de volume negativo e positivo.
Como ler:
- Média móvel crossovers são usados para ajudar a determinar uma possível mudança ou retração de tendência.
- A nuvem da área na parte inferior é calculada pela diferença das médias móveis. Isso pode ser usado para ajudar a determinar a força do volume de tendências.
- Barras de volume coloridas brilhantes são grandes picos de volume calculados pelo fator x nas opções.
Mã được bảo vệ
Tập lệnh này được đăng dưới dạng mã nguồn đóng. Tuy nhiên, bạn có thể sử dụng tự do và không giới hạn – tìm hiểu thêm tại đây.
Thông báo miễn trừ trách nhiệm
Thông tin và các ấn phẩm này không nhằm mục đích, và không cấu thành, lời khuyên hoặc khuyến nghị về tài chính, đầu tư, giao dịch hay các loại khác do TradingView cung cấp hoặc xác nhận. Đọc thêm tại Điều khoản Sử dụng.