PROTECTED SOURCE SCRIPT
7D Historical Volatility (Regimes + Stats) - Chrrizzy
Here’s what that indicator does—at a glance:
### Core idea
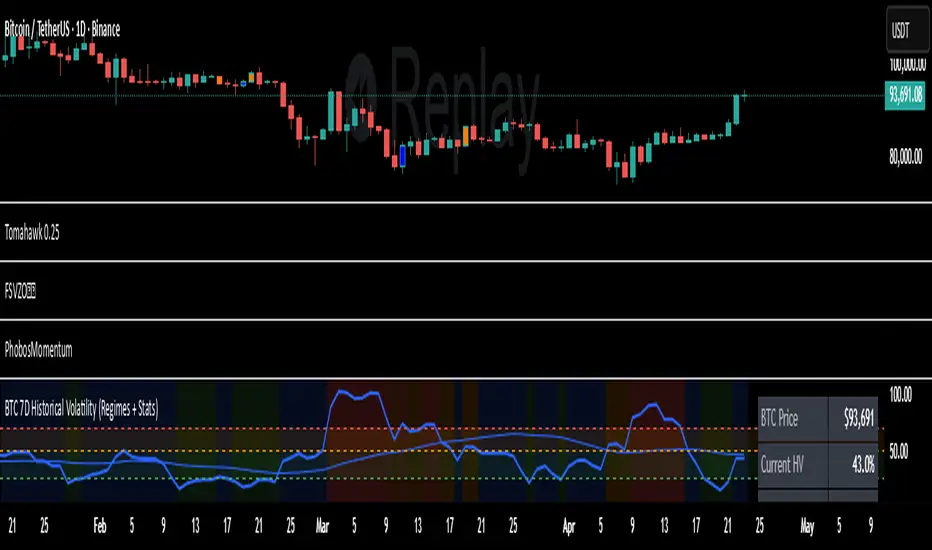
It computes **7-day Historical Volatility (HV)** from **daily** log returns (annualized), then shows:
* the **HV line** and its **30-day average**,
* colored **volatility regimes** (Low / Normal / High / Extreme) with thresholds you set,
* a compact **status panel** (top-right, nudged left) with current stats and time-in-zone.
### Calculations
* **HV (7D)**: `stdev(log(close/close[1]), 7) * sqrt(365) * 100`, always from **daily data** via `request.security`, so it’s consistent on any chart timeframe.
* **Regimes** (defaults):
Low < 25% • Normal 25–50% • High 50–70% • Extreme > 70% (all editable).
* **30-day avg**: SMA of HV.
* **Time in zone (% over window)**: SMA of boolean flags (e.g., in Low=1 else 0) over `statsWin` days (default 300).
* **Rolling median HV**: 50th percentile over `statsWin`.
### What you see on the chart
* **HV line** (bold) + **30-day HV** (lighter).
* **Horizontal dashed lines** at your regime thresholds.
* **Background shading** that changes with the current regime (green/blue/orange/red).
### Panel (top-right)
Shows:
* BTC Price (daily close)
* Current HV
* 30-day Avg HV
* Median HV (over window)
* Current **Regime**
* A two-line summary: **% of time spent** in Low / Normal / High / Extreme over the chosen window.
The panel is shifted slightly left using a hidden spacer column; tweak the **“Panel right padding (chars)”** input to move it.
### Alerts (ready to use)
* **HV crossed up Low**
* **HV crossed down Low**
* **HV crossed up High**
* **HV crossed up Extreme**
### Inputs you can tune
* `HV Lookback (days)` (default 7)
* `Average HV (days)` (default 30)
* Thresholds: Low/High/Extreme
* `Stats Window (days)` (default 300)
* Panel padding, toggle table/zones on/off.
### How to use it
* **Context**: quickly see if BTC is in **compressed** (Low) or **stressed** (High/Extreme) volatility.
* **Regime cross alerts**: get notified when volatility **expands** from Low (potential breakout conditions) or pushes into High/Extreme (risk increases).
* **Stats/median**: compare today’s HV to its typical level over your lookback window.
If you want, I can add an **HV percentile rank** (e.g., “Current HV is at the 38th percentile over 300d”) or mirror the **low-vol breakout signal** from Script A into this panel.
### Core idea
It computes **7-day Historical Volatility (HV)** from **daily** log returns (annualized), then shows:
* the **HV line** and its **30-day average**,
* colored **volatility regimes** (Low / Normal / High / Extreme) with thresholds you set,
* a compact **status panel** (top-right, nudged left) with current stats and time-in-zone.
### Calculations
* **HV (7D)**: `stdev(log(close/close[1]), 7) * sqrt(365) * 100`, always from **daily data** via `request.security`, so it’s consistent on any chart timeframe.
* **Regimes** (defaults):
Low < 25% • Normal 25–50% • High 50–70% • Extreme > 70% (all editable).
* **30-day avg**: SMA of HV.
* **Time in zone (% over window)**: SMA of boolean flags (e.g., in Low=1 else 0) over `statsWin` days (default 300).
* **Rolling median HV**: 50th percentile over `statsWin`.
### What you see on the chart
* **HV line** (bold) + **30-day HV** (lighter).
* **Horizontal dashed lines** at your regime thresholds.
* **Background shading** that changes with the current regime (green/blue/orange/red).
### Panel (top-right)
Shows:
* BTC Price (daily close)
* Current HV
* 30-day Avg HV
* Median HV (over window)
* Current **Regime**
* A two-line summary: **% of time spent** in Low / Normal / High / Extreme over the chosen window.
The panel is shifted slightly left using a hidden spacer column; tweak the **“Panel right padding (chars)”** input to move it.
### Alerts (ready to use)
* **HV crossed up Low**
* **HV crossed down Low**
* **HV crossed up High**
* **HV crossed up Extreme**
### Inputs you can tune
* `HV Lookback (days)` (default 7)
* `Average HV (days)` (default 30)
* Thresholds: Low/High/Extreme
* `Stats Window (days)` (default 300)
* Panel padding, toggle table/zones on/off.
### How to use it
* **Context**: quickly see if BTC is in **compressed** (Low) or **stressed** (High/Extreme) volatility.
* **Regime cross alerts**: get notified when volatility **expands** from Low (potential breakout conditions) or pushes into High/Extreme (risk increases).
* **Stats/median**: compare today’s HV to its typical level over your lookback window.
If you want, I can add an **HV percentile rank** (e.g., “Current HV is at the 38th percentile over 300d”) or mirror the **low-vol breakout signal** from Script A into this panel.
Mã được bảo vệ
Tập lệnh này được đăng dưới dạng mã nguồn đóng. Tuy nhiên, bạn có thể sử dụng tự do và không giới hạn – tìm hiểu thêm tại đây.
Thông báo miễn trừ trách nhiệm
Thông tin và các ấn phẩm này không nhằm mục đích, và không cấu thành, lời khuyên hoặc khuyến nghị về tài chính, đầu tư, giao dịch hay các loại khác do TradingView cung cấp hoặc xác nhận. Đọc thêm tại Điều khoản Sử dụng.