PROTECTED SOURCE SCRIPT
True Relative Volume

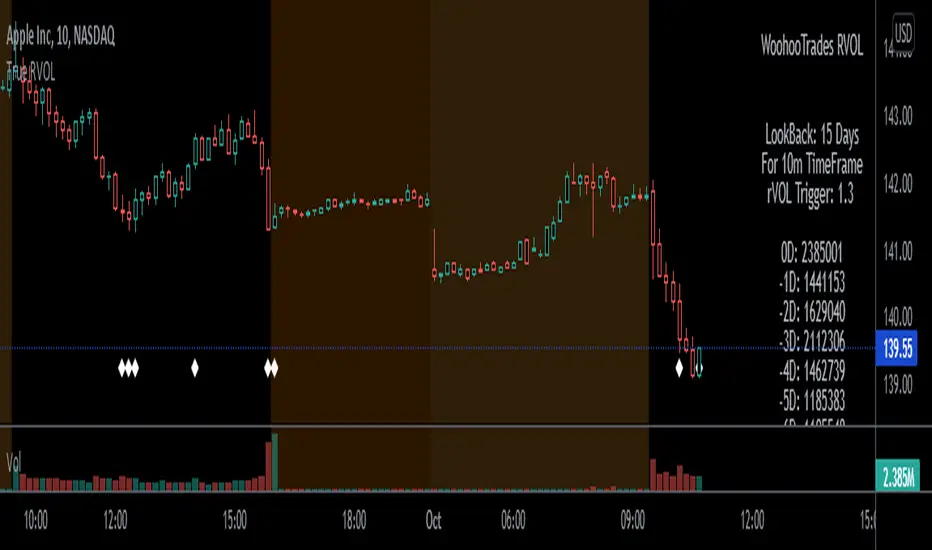
Relative Volume shows traders how "in-play" a current stonk is. Works great for day traders and scalpers!
Volume of Current TimeFrame's ratio to the average volume over X days back on the same time frame.
ie .
z = Volume at 0930-0940am over X days period divided by X
rVol = current volume divided by z
Dots at the bottom to indicate candles whose RVOL is morethan set minimum ratio.
Yes, its only 5 and 10 minutes. Might do calculations for other timeframes if this gets a good following.
Only works on US market session. 0930am to 0400pm EST.
Play Strategies :
- on break of support/resistance, if rvol supports action, ride direction of price action.
- look for in-play names, wait for price action to return to support/resistance area on low volume then
revisit if a bounce on the support/resistance line is supported by rVol again.
REMINDER!!!
This works only on 5 and 10 minutes TF. Dont forget to change your chart's timeframes.
This script will calculate erroneously if timeframe set on script and chart's current time frame are different.
Works even if extended market is enabled on your charts. It only looks at 0930 - 1600 EST bars.
Enjoy! Would love to hear your thoughts.
Mã được bảo vệ
Tập lệnh này được đăng dưới dạng mã nguồn đóng. Tuy nhiên, bạn có thể sử dụng tự do và không giới hạn – tìm hiểu thêm tại đây.
Thông báo miễn trừ trách nhiệm
Thông tin và các ấn phẩm này không nhằm mục đích, và không cấu thành, lời khuyên hoặc khuyến nghị về tài chính, đầu tư, giao dịch hay các loại khác do TradingView cung cấp hoặc xác nhận. Đọc thêm tại Điều khoản Sử dụng.