OPEN-SOURCE SCRIPT
MACD_STO-SAMI

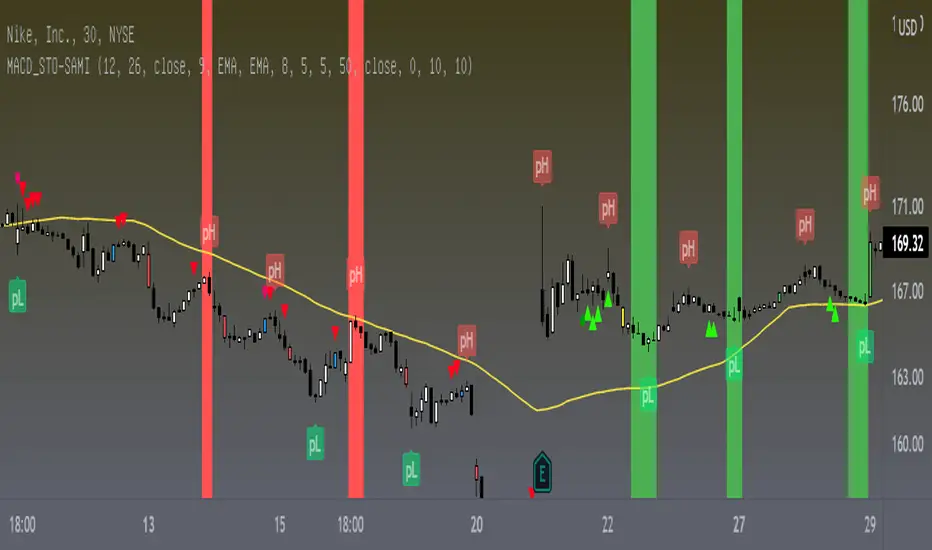
This indicator depends on the trend. You must first determine the general trend and then wait for the signals that indicate buying in the bullish direction and the signals that indicate selling in the bearish direction, which is the green signal is considered buying and the red signal is considered selling
Also, this indicator differs from the rest of the indicators that the signal is prior to the movement of hair, meaning that it is predictive and is strong.
The green bar is the buying peak.
The red bar is oversold.
The red arrows indicate that you can sell, but the price must be monitored.
The green arrows indicate that it is possible to buy and monitor the price
The colored candles are 4, and each candle indicates the order of the candle.
1- The blue candle indicates a change in the bearish trend and the possibility of it changing to an upward trend.
2- The green candle, which indicates that there will be acceleration in the upward direction.
3- The yellow candle indicates a change in the upward trend and the possibility of it changing to the downside.
4- The red candle indicates that there will be acceleration in the downside direction
To help determine the trend, the average of the 50 simple has been set
Mã nguồn mở
Theo đúng tinh thần TradingView, tác giả của tập lệnh này đã công bố nó dưới dạng mã nguồn mở, để các nhà giao dịch có thể xem xét và xác minh chức năng. Chúc mừng tác giả! Mặc dù bạn có thể sử dụng miễn phí, hãy nhớ rằng việc công bố lại mã phải tuân theo Nội quy.
Thông báo miễn trừ trách nhiệm
Thông tin và các ấn phẩm này không nhằm mục đích, và không cấu thành, lời khuyên hoặc khuyến nghị về tài chính, đầu tư, giao dịch hay các loại khác do TradingView cung cấp hoặc xác nhận. Đọc thêm tại Điều khoản Sử dụng.