OPEN-SOURCE SCRIPT
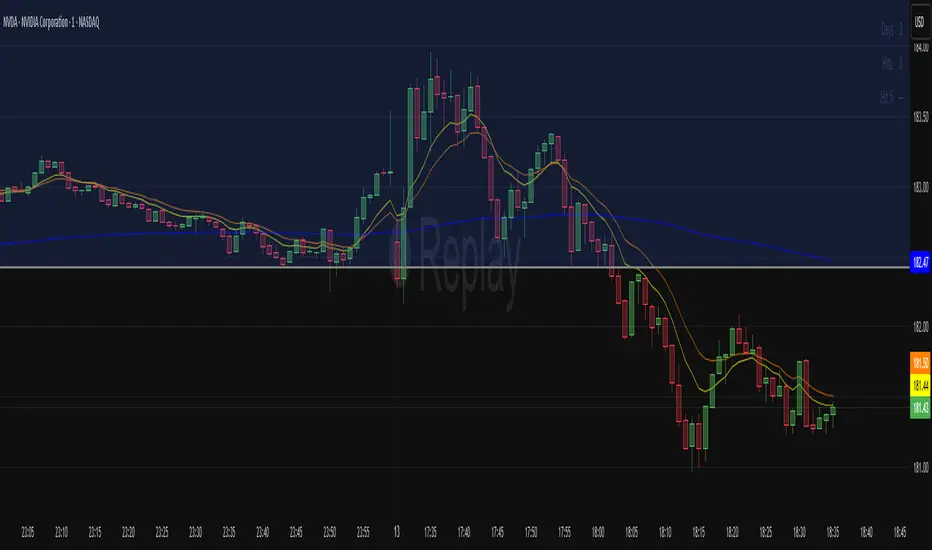
Prev-Day POC Hit Rate (v6, RTH, tolerance)

//version=6
indicator("Prev-Day POC Hit Rate (v6, RTH, tolerance)", overlay=true)
// ---- Inputs
sessionStr = input.session("0930-1600", "RTH session (exchange time)")
tolPoints = input.float(0.10, "Tolerance (points)")
tolPercent = input.float(0.10, "Tolerance (%) of prev POC")
showMarks = input.bool(true, "Show touch markers")
// ---- RTH gating in exchange TZ
sessFlag = time(timeframe.period, sessionStr)
inRTH = not na(sessFlag)
rthOpen = inRTH and not inRTH[1]
rthClose = (not inRTH) and inRTH[1]
// ---- Prior-day POC proxy = price of highest-volume 1m bar of prior RTH
var float prevPOC = na
var float curPOC = na
var float curMaxVol = 0.0
// ---- Daily hit stats
var bool hitToday = false
var int days = 0
var int hits = 0
// Finalize a day at RTH close (count touch to prevPOC)
if rthClose and not na(prevPOC)
days += 1
if hitToday
hits += 1
// Roll today's POC to prevPOC at next RTH open; reset builders/flags
if rthOpen
prevPOC := curPOC
curPOC := na
curMaxVol := 0.0
hitToday := false
// Build today's proxy POC during RTH (highest-volume 1m bar)
if inRTH
if volume > curMaxVol
curMaxVol := volume
curPOC := close // swap to (high+low+close)/3 if you prefer HLC3
// ---- Touch test against prevPOC (band = max(points, % of prevPOC))
bandPts = na(prevPOC) ? na : math.max(tolPoints, prevPOC * tolPercent * 0.01)
touched = inRTH and not na(prevPOC) and high >= (prevPOC - bandPts) and low <= (prevPOC + bandPts)
if touched
hitToday := true
// ---- Plots
plot(prevPOC, "Prev RTH POC (proxy)", color=color.new(color.fuchsia, 0), linewidth=2, style=plot.style_linebr)
bgcolor(hitToday and inRTH ? color.new(color.green, 92) : na)
plotshape(showMarks and touched ? prevPOC : na, title="Touch prev POC",
style=shape.circle, location=location.absolute, size=size.tiny, color=color.new(color.aqua, 0))
// ---- On-chart stats
hitPct = days > 0 ? (hits * 100.0 / days) : na
var table T = table.new(position.top_right, 2, 3, border_width=1)
if barstate.islastconfirmedhistory
table.cell(T, 0, 0, "Days")
table.cell(T, 1, 0, str.tostring(days))
table.cell(T, 0, 1, "Hits")
table.cell(T, 1, 1, str.tostring(hits))
table.cell(T, 0, 2, "Hit %")
table.cell(T, 1, 2, na(hitPct) ? "—" : str.tostring(hitPct, "#.0") + "%")
Mã nguồn mở
Theo đúng tinh thần TradingView, người tạo ra tập lệnh này đã biến tập lệnh thành mã nguồn mở để các nhà giao dịch có thể xem xét và xác minh công năng. Xin dành lời khen tặng cho tác giả! Mặc dù bạn có thể sử dụng miễn phí, nhưng lưu ý nếu đăng lại mã, bạn phải tuân theo Quy tắc nội bộ của chúng tôi.
Thông báo miễn trừ trách nhiệm
Thông tin và ấn phẩm không có nghĩa là và không cấu thành, tài chính, đầu tư, kinh doanh, hoặc các loại lời khuyên hoặc khuyến nghị khác được cung cấp hoặc xác nhận bởi TradingView. Đọc thêm trong Điều khoản sử dụng.