OPEN-SOURCE SCRIPT
Cập nhật Naked - Daily Weekly Monthly

User request for Naked Daily Weekly Monthly Opens.
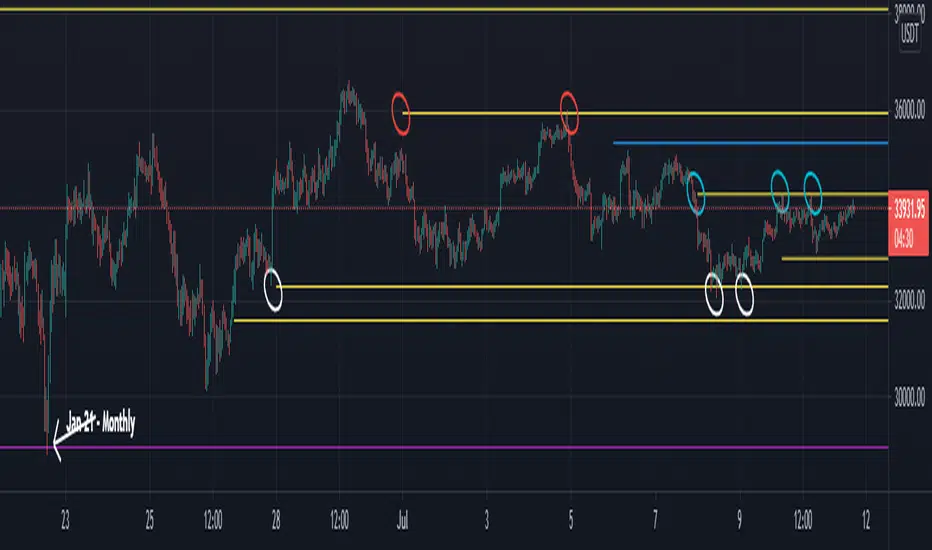
This indicator plots the Daily Weekly Opens (the day after day after creation), they then will stay on the chart until a candle close is completed on the other side of the plot.
In the above chart picture you can see how previous monthly and daily opens have acted as support and resistance.
Thanks go to:
StackOverFlow Bjorn Mistiaen
Phát hành các Ghi chú
Disclaimer This indicator works on the daily timeframe and below.
To pick up all naked lines move the chart back in time and then back to current price action.
Phát hành các Ghi chú
Update:User request for different line style options.
User can now change the line style from solid to dashed or dotted.
Phát hành các Ghi chú
Error highlighted by user in comments. Code updated to resolve issue.
Phát hành các Ghi chú
Script update:The script will now show totally Naked and Partially Naked Daily / Weekly / Monthly opens.
When looking back a previous price action keeping the partially Naked Opens as an option looks like a promising level for Technical Analysis.
Totally Naked = No price action breaks the level.
Partially Naked = Either the close or the open candles (Timeframe dependent) has not occurred below or above the level (dependent on Price Action to the level above or below).
Mã nguồn mở
Theo đúng tinh thần TradingView, tác giả của tập lệnh này đã công bố nó dưới dạng mã nguồn mở, để các nhà giao dịch có thể xem xét và xác minh chức năng. Chúc mừng tác giả! Mặc dù bạn có thể sử dụng miễn phí, hãy nhớ rằng việc công bố lại mã phải tuân theo Nội quy.
Thông báo miễn trừ trách nhiệm
Thông tin và các ấn phẩm này không nhằm mục đích, và không cấu thành, lời khuyên hoặc khuyến nghị về tài chính, đầu tư, giao dịch hay các loại khác do TradingView cung cấp hoặc xác nhận. Đọc thêm tại Điều khoản Sử dụng.