PROTECTED SOURCE SCRIPT
Cập nhật EnVol Lite By TradeINski
EnVol Lite By TradeINski
First things first,
This indicator is inspired by Enhanced Volume By TradeINski.
Best suited for momentum/ swing traders whose primary trade timeframe is Daily charts.
Suitable for for dark and light theme of trading view
Contents of the indicator.
1. Moving Average
2. Bar Colors
(a) Default Up & Down
(b) Relatively Up & Down
1. Moving Average
This is a simple moving average line plotted over a specific period of time frame. Default Value is 50 that means average number of shares that are volume traded over the last 50 days.
{Input}
Users have the option to change Period as per their requirement.
{Style}
Users have the option to change Show/Hide the line with "Check Mark".
Users can also change color, thickness and type of representation. "MA line".
2. Bar Colors
(a) Default Up & Down
- If on any specific day % change is positive then that day's volume bar is colored in teal. Hence default Up.
- If on any specific day %change is negative then that day's volume bar is colored in red. Hence Default Down.
- My interpretation for Default Up & Down day is its "Usual volume - usual activity"
(b)Relatively Up & Down
- To get a better understanding of relative Volume it's absolutely necessary to learn about ADR, which is Average daily range. This is coordinates with price not volume of the ticker.
Now ADR Calculation is based on High and low of the day that is average percentage change over a specified period of days. Here the period considered is 20 days.
- Now If on any specific day %change is positive that is up day, Specific day volume is 2 times the average volume and %change is 2 times the ADR then it is considered as relatively Up.
Similarly If on any specific day %change is negative that is down day, Specific day volume is 2 times the average volume and %change is 2 times the ADR then it is considered as relatively own.
- My interpretation for Relatively Up & Down day is its "unusual volume - unusual activity"
{Inputs}
- Users can change colors as per their preference. Default colors are for Default Up "Teal", Default Down "Red", Relatively Up "Lime" and for Relatively Down is "Fuchsia".
Phát hành các Ghi chú
1. Removed Moving Average2. Added Momentum Burst
when ever conditions are satisfied then lime and fuchsia color is used
Users have many options to explore.
3. Added EP 9 Million
When ever volume is more than specified Volume then orange color arrow mark is marked below the volume bar.
Phát hành các Ghi chú
Added Table with 2 new metric's1. Trend Intensity (TI)
TI is calculated based on slow moving MA and fast moving MA.
Note: TI65 is offset with 1 day
2. Persistent Intensity (PI)
This is calculated based on comparison of green and red bars based on specified period.
Both have default period as 21
Phát hành các Ghi chú
Added Relative Volume - Todays volume with respect to yesterdays volumePhát hành các Ghi chú
Added,1. Display option for the table - Text/Values.
2. User settings to change text color of the table.
Phát hành các Ghi chú
Minor changes in table settings.Phát hành các Ghi chú
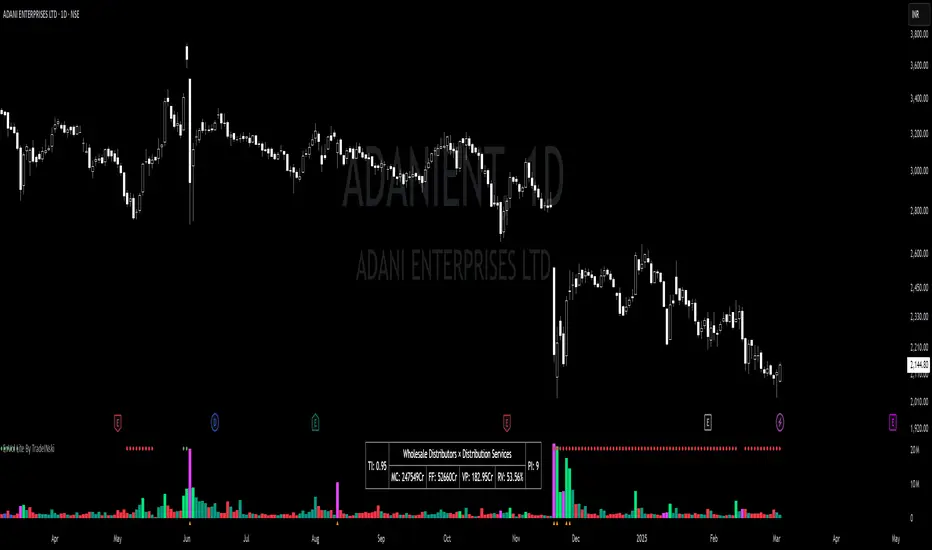
Added Features,1. Industry & Sector
2. MC - Market Capitalization
3. FF - Free Float
4. VP - Volume × Price
5. RV - Relative Volume (Existed with Minor fix)
Additional Updates,
1. Overall UI UX changes
2. Few default settings are changed
Phát hành các Ghi chú
Added Trend Intensity marker with added customizability for the users.Default Trend Intensity is TI_65
Phát hành các Ghi chú
Default Setting changed.Phát hành các Ghi chú
Version Upgrade: Updated the script to Pine Script™ v6 for enhanced compatibility and functionality.Table Customization: Added input options for table line color and background color for improved visual customization.
Code Simplification: Refined conditional statements and removed redundant variables for better readability and efficiency.
Position Settings: Enhanced table positioning flexibility by providing clearer input options and extended customization for text size and alignment.
Minor Enhancements: Improved tooltip descriptions and default values for several inputs, ensuring better usability for traders.
These changes streamline the script, enhance its visual customization, and improve the user experience, especially for traders seeking better insights and adaptability.
Phát hành các Ghi chú
Volume show in lower TF also.Phát hành các Ghi chú
This new settings group provides options specifically for intraday timeframes:- Moving Average (MA) Line: An option to display a moving average line on the volume bars. This helps visualize the average volume over a specified period, making it easier to identify volume spikes and dry periods. Users can customize the MA period and color.
- Dry Volume: An option to color volume bars gray if they are below the moving average. This visually distinguishes low-volume periods from the average volume activity.
- Volume Spike: An option to highlight volume spikes with different colors (lime for up spikes and fuchsia for down spikes) if the volume exceeds a user-defined multiple of the average volume. This helps quickly identify significant volume surges.
Phát hành các Ghi chú
Default settings changed.Phát hành các Ghi chú
Key features of the LTF Table:- Customizable position: Users can choose where the table appears on the chart.
- Adjustable size: Text size can be adjusted from 'Tiny' to 'Huge'.
- Flexible display: Choose to display values with or without labels.
- Color options: Customize table lines, background, and text color.
- Risk management: Input your risk amount, and the table calculates the corresponding position size based on the distance to the VWAP.
- Show/Hide Amount: Optionally display the risk amount in the table.
Phát hành các Ghi chú
Day Volume shows in DTF.Phát hành các Ghi chú
Removed all intraday features.Mã được bảo vệ
Tập lệnh này được đăng dưới dạng mã nguồn đóng. Tuy nhiên, bạn có thể sử dụng tự do và không giới hạn – tìm hiểu thêm tại đây.
Thông báo miễn trừ trách nhiệm
Thông tin và các ấn phẩm này không nhằm mục đích, và không cấu thành, lời khuyên hoặc khuyến nghị về tài chính, đầu tư, giao dịch hay các loại khác do TradingView cung cấp hoặc xác nhận. Đọc thêm tại Điều khoản Sử dụng.
Mã được bảo vệ
Tập lệnh này được đăng dưới dạng mã nguồn đóng. Tuy nhiên, bạn có thể sử dụng tự do và không giới hạn – tìm hiểu thêm tại đây.
Thông báo miễn trừ trách nhiệm
Thông tin và các ấn phẩm này không nhằm mục đích, và không cấu thành, lời khuyên hoặc khuyến nghị về tài chính, đầu tư, giao dịch hay các loại khác do TradingView cung cấp hoặc xác nhận. Đọc thêm tại Điều khoản Sử dụng.