PROTECTED SOURCE SCRIPT
Cập nhật Borjas Tarh Explosive Pivots

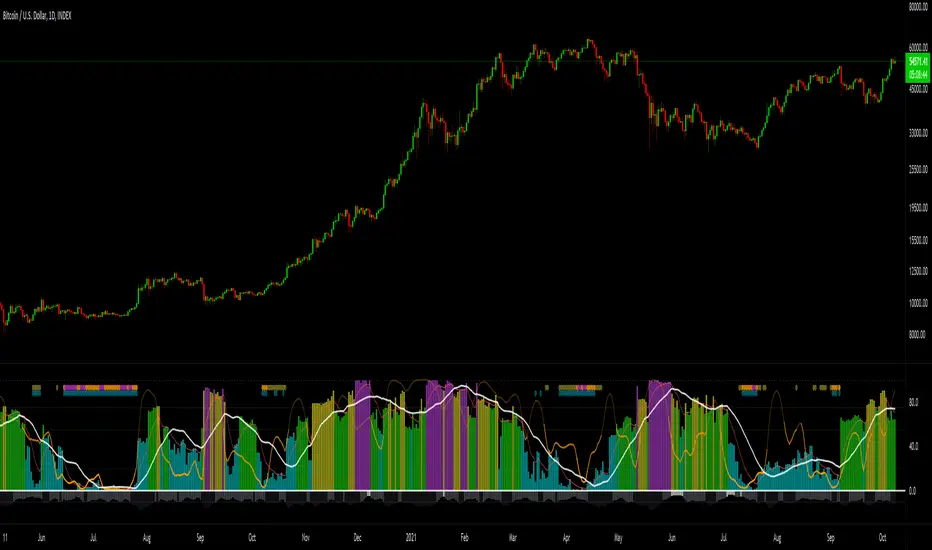
Borjas Tarh Explosive Pivots
This indicator includes:
1. Historical Volatility Percentile (HVP) +SMA+EMA
Core Idea (balipour):
HVP Code Help (semiotic): tradingview.com/u/semiotic
For the Detailed Description read the Core (HVP) Idea indicator by "balipour" above.
2. Bollinger Bands Width (BBW)
It's an Oscillation of BBW So it's trapped between 0 to 100. (And Lightly Smoothed)
3. Volume Oscillator
The Volume is oscillated so it's trapped between 0 and -30. (And Lightly Smoothed)
Below 10 Means the Volume in the context of the Candle Volume is pretty low.
4. The Shapes
These Shapes are based of all factors above.
D (Blue) : HVPis pretty Low. An Explosive Move is Coming.
A (Yellow) : An Explosive Move is Building Up.
B (Orange) : An Explosive Move is Near.
C (Purple) : An Explosive Move Will Happen Very Soon.
There is an Alternative Set:
On = Annual HVP and Default BBW.
Off = Fibonacci HVP and BBW.
© mrhashem
© Borjas Tarh Company
This indicator includes:
1. Historical Volatility Percentile (HVP) +SMA+EMA
Core Idea (balipour):

HVP Code Help (semiotic): tradingview.com/u/semiotic
For the Detailed Description read the Core (HVP) Idea indicator by "balipour" above.
2. Bollinger Bands Width (BBW)
It's an Oscillation of BBW So it's trapped between 0 to 100. (And Lightly Smoothed)
3. Volume Oscillator
The Volume is oscillated so it's trapped between 0 and -30. (And Lightly Smoothed)
Below 10 Means the Volume in the context of the Candle Volume is pretty low.
4. The Shapes
These Shapes are based of all factors above.
D (Blue) : HVPis pretty Low. An Explosive Move is Coming.
A (Yellow) : An Explosive Move is Building Up.
B (Orange) : An Explosive Move is Near.
C (Purple) : An Explosive Move Will Happen Very Soon.
There is an Alternative Set:
On = Annual HVP and Default BBW.
Off = Fibonacci HVP and BBW.
© mrhashem
© Borjas Tarh Company
Phát hành các Ghi chú
Settings Updated.Phát hành các Ghi chú
Style Update.Phát hành các Ghi chú
Added 2 types of Smoothing:Options:
No Smoothing
Lite Smoothing
Heavy Smoothing
Source Update. Code Tweaks.
Phát hành các Ghi chú
Updated BBW Formula.Updated Code Styling.
Phát hành các Ghi chú
Updated to v5 Pinescript.Mã được bảo vệ
Tập lệnh này được đăng dưới dạng mã nguồn đóng. Tuy nhiên, bạn có thể sử dụng tự do và không giới hạn – tìm hiểu thêm tại đây.
Thông báo miễn trừ trách nhiệm
Thông tin và các ấn phẩm này không nhằm mục đích, và không cấu thành, lời khuyên hoặc khuyến nghị về tài chính, đầu tư, giao dịch hay các loại khác do TradingView cung cấp hoặc xác nhận. Đọc thêm tại Điều khoản Sử dụng.
Mã được bảo vệ
Tập lệnh này được đăng dưới dạng mã nguồn đóng. Tuy nhiên, bạn có thể sử dụng tự do và không giới hạn – tìm hiểu thêm tại đây.
Thông báo miễn trừ trách nhiệm
Thông tin và các ấn phẩm này không nhằm mục đích, và không cấu thành, lời khuyên hoặc khuyến nghị về tài chính, đầu tư, giao dịch hay các loại khác do TradingView cung cấp hoặc xác nhận. Đọc thêm tại Điều khoản Sử dụng.