OPEN-SOURCE SCRIPT
[Hoss] VWAP AD
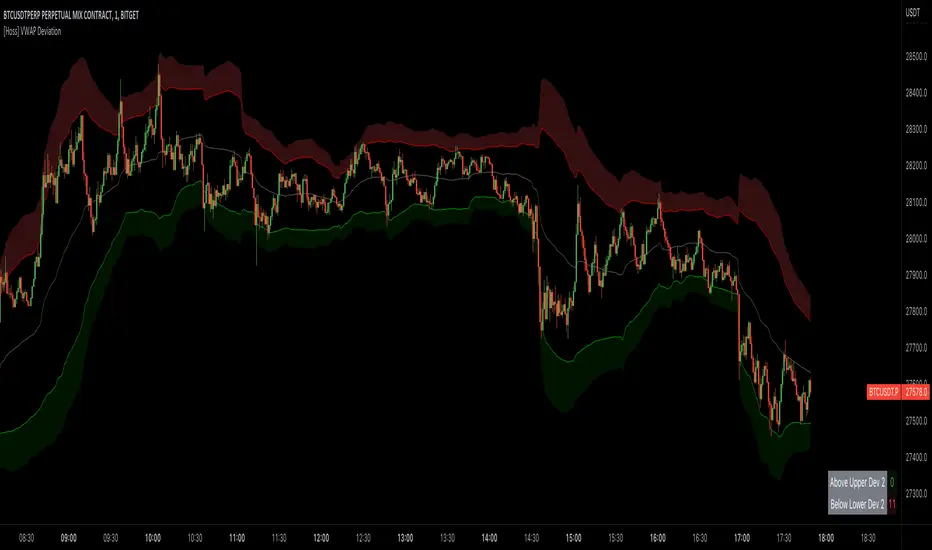
The VWAP ( Volume Weighted Average Price ) Deviation script is a powerful tool designed for traders to analyze the relationship between price and volume . By calculating deviations around the VWAP , the script allows users to identify key support and resistance levels that can help in making better-informed trading decisions.
The script calculates VWAP based on the chosen data source (default is closing price) and then computes deviations above and below the VWAP using either the Average Deviation or the Standard Deviation method. The user can select the desired method through the script's input options. These deviations are then plotted as bands on the chart, providing a visual representation of the areas where the price may potentially revert or experience a breakout.
A unique and valuable feature of this script is the addition of a monitor that counts the number of times the price crosses above the Upper Deviation level 2 and below the Lower Deviation level 2 within a user-defined lookback period. This monitor is displayed as a table in the bottom right corner of the chart and can be enabled or disabled through an input option.
The cross count monitor serves as a valuable aid to traders by providing insights into the historical frequency of price crossing the deviation levels. This information can be used to identify potential trading opportunities based on historical price behavior around these levels.
Mã nguồn mở
Theo đúng tinh thần TradingView, tác giả của tập lệnh này đã công bố nó dưới dạng mã nguồn mở, để các nhà giao dịch có thể xem xét và xác minh chức năng. Chúc mừng tác giả! Mặc dù bạn có thể sử dụng miễn phí, hãy nhớ rằng việc công bố lại mã phải tuân theo Nội quy.
macro maximalist
Thông báo miễn trừ trách nhiệm
Thông tin và các ấn phẩm này không nhằm mục đích, và không cấu thành, lời khuyên hoặc khuyến nghị về tài chính, đầu tư, giao dịch hay các loại khác do TradingView cung cấp hoặc xác nhận. Đọc thêm tại Điều khoản Sử dụng.