PROTECTED SOURCE SCRIPT
Cập nhật 3D-WAVE-PM indicator
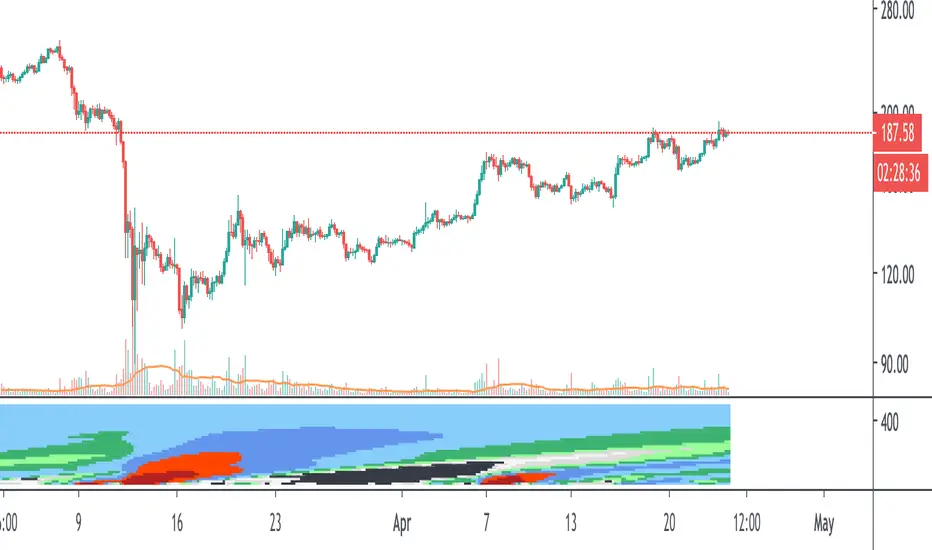
This is an extension of the WAVE-PM indicator as explained by Mark Whistler in his book Volatility Illuminated.
This heatmap represent different lengths of WAVE-PM indicator, starting from 20 and incremented by 15 until 485.
As a reminder, WAVE-PM compare the size of the current distribution to the last 100.
The result is represented as a number between 0 and 1.
The more close to 0, the more contracted the distribution is.
The more close to 1, the more expanded the distribution is.
The color code is the same as my standard WAVE-PM indicator :
Between 0.35 and 0.5 also known as the "Gear change" level => Grey
Between 0.5 and 0.7 also known as the "Consolidation" level => Green
Between 0.7 and 0.9 also known as the "Breakout" level => Blue
Between 0.9 and 1 also known as the "Danger" level => Red
Note that i have colored results below 0.35 as black
Note also that each level has been divided in 2 colors : The light one for the lower half of the range and the dark one for the higher half.
You should resize the indicator window to have a clear and continuous heatmap.
Phát hành các Ghi chú
- Updated to pinescript v4Mã được bảo vệ
Tập lệnh này được đăng dưới dạng mã nguồn đóng. Tuy nhiên, bạn có thể sử dụng tự do và không giới hạn – tìm hiểu thêm tại đây.
Thông báo miễn trừ trách nhiệm
Thông tin và các ấn phẩm này không nhằm mục đích, và không cấu thành, lời khuyên hoặc khuyến nghị về tài chính, đầu tư, giao dịch hay các loại khác do TradingView cung cấp hoặc xác nhận. Đọc thêm tại Điều khoản Sử dụng.
Mã được bảo vệ
Tập lệnh này được đăng dưới dạng mã nguồn đóng. Tuy nhiên, bạn có thể sử dụng tự do và không giới hạn – tìm hiểu thêm tại đây.
Thông báo miễn trừ trách nhiệm
Thông tin và các ấn phẩm này không nhằm mục đích, và không cấu thành, lời khuyên hoặc khuyến nghị về tài chính, đầu tư, giao dịch hay các loại khác do TradingView cung cấp hoặc xác nhận. Đọc thêm tại Điều khoản Sử dụng.