PROTECTED SOURCE SCRIPT
ATR vs Gain/Loss Ratio_By Rao_GS (with TR (RSI) Confirmation)
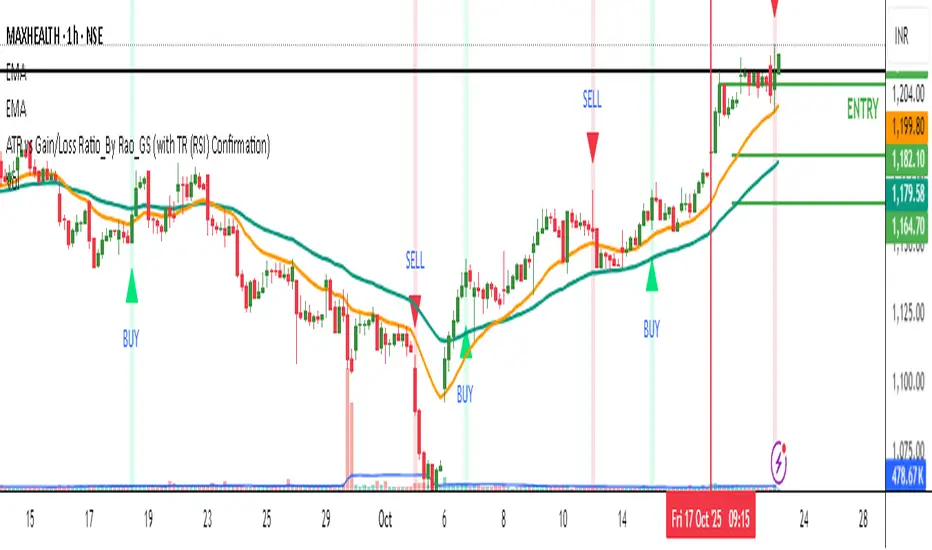
Description: ATR vs Gain/Loss Ratio_By Rao_GS (with TR (RSI) Confirmation)
🔍 Overview
The ATR vs Gain/Loss Ratio indicator by Rao_GS is a volatility-driven momentum tool designed to detect strong directional shifts confirmed by the relationship between Average True Range (ATR) and the average Gain/Loss ratios.
It helps identify points where volatility expansion aligns with momentum reversal — providing high-probability BUY and SELL zones.
⚙️ Core Logic
ATR (Average True Range):
Measures volatility using the range between high and low prices.
Gain/Loss Averages:
Calculates the average of positive (gain) and negative (loss) movements over a user-defined period.
ATR Ratios:
ATR / Avg Gain and ATR / Avg Loss create two oscillating curves.
Crossover Detection:
Buy Signal → When the ATR/Gain ratio crosses above the ATR/Loss ratio during high volatility.
Sell Signal → When the ATR/Gain ratio crosses below the ATR/Loss ratio during high volatility.
Volatility Confirmation (TR Filter):
The True Range (TR) must be at least a certain multiple of ATR (default 1.1×) to confirm genuine market momentum.
🎯 Signals
🟢 BUY:
Occurs when bullish momentum strengthens (ATR/Gain > ATR/Loss) and volatility confirms the move.
🔴 SELL:
Occurs when bearish momentum dominates (ATR/Loss > ATR/Gain) under heightened volatility.
Background color highlights active signal zones:
Light Green → Confirmed BUY zone
Light Red → Confirmed SELL zone
📈 Visualization
Lime Line: ATR/Gain ratio
Red Line: ATR/Loss ratio
Triangles:
🟢 Up triangle → Buy
🔴 Down triangle → Sell
This design allows traders to see both volatility shifts and momentum transitions together on a single overlay chart.
Mã được bảo vệ
Tập lệnh này được đăng dưới dạng mã nguồn đóng. Tuy nhiên, bạn có thể tự do sử dụng tập lệnh mà không có bất kỳ hạn chế nào – tìm hiểu thêm tại đây.
Thông báo miễn trừ trách nhiệm
Thông tin và ấn phẩm không có nghĩa là và không cấu thành, tài chính, đầu tư, kinh doanh, hoặc các loại lời khuyên hoặc khuyến nghị khác được cung cấp hoặc xác nhận bởi TradingView. Đọc thêm trong Điều khoản sử dụng.