PROTECTED SOURCE SCRIPT
Key levels + Session Range (Sweep-Aware Levels)
Overview
This indicator provides a single, clean view of two core intraday contexts that day traders rely on:
Daily Liquidity Levels: prior day high/low (PDH/PDL), prior day open/close, weekly highs/lows, and other commonly referenced reference points.
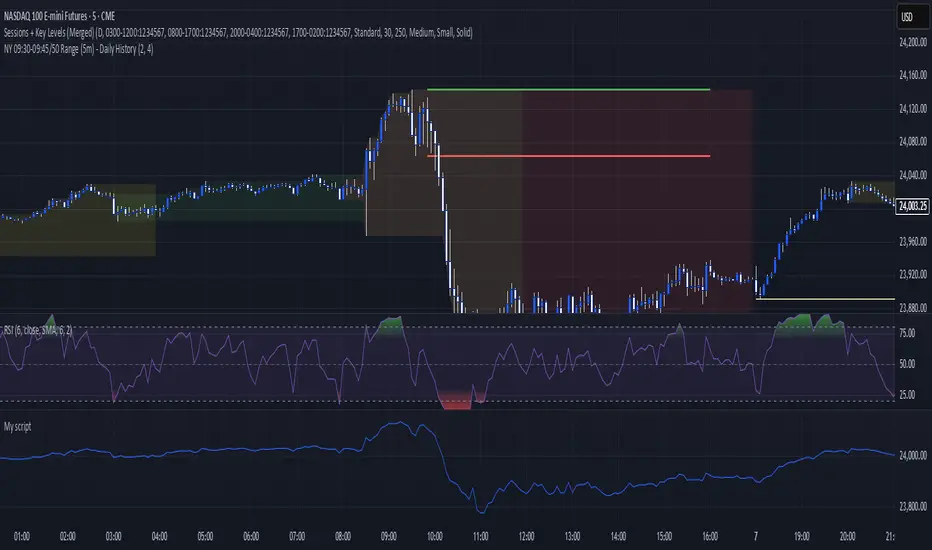
Session Ranges: clearly plotted high/low for each active session (e.g., Asia, London, New York), tracked live as the session evolves.
By unifying these two information layers, traders can immediately see when price is sweeping a session’s extremes into known daily liquidity—a frequent precursor to reversals or continuation moves. This saves chart space, reduces cognitive overload, and turns two separate checks into one coherent read.
What it does
Plots daily liquidity references: previous day high/low, previous day open/close, and optional higher-timeframe levels (open, high, mid and low 4H ,Day, Week, month, year and quarterly).
Tracks session high/low live: as each session unfolds, the indicator updates that session’s running High and Low, then locks them at session end.
Maps interaction between the two layers: you can instantly spot session sweeps that tag PDH/PDL (or weekly extremes), highlight potential liquidity grabs, and frame risk with objective boundaries.
Keeps the chart clean: just essential lines/zones and concise labels—no extra clutter.
Why it’s useful & original
Single-purpose integration: Rather than a generic mashup, this is a purpose-built fusion where session dynamics are read in the context of daily liquidity. That relationship is the core edge—seeing when a session sweep aligns with known liquidity pools.
Workflow efficiency: One overlay replaces two indicators, simplifying visibility and reducing conflicting visuals.
Decision clarity: The combination highlights setups many intraday traders already watch manually (e.g., NY session high sweep into PDH), but makes them obvious in real time.
How it works (plain-English logic)
Daily Liquidity Engine
At the start of each day, the indicator records PDH, PDL, prior open/close and (optionally) prior week high/low.
These levels are plotted and extended across the session as static references.
Session Range Tracker
For each defined session (e.g., Asia/London/New York), the script initializes session High/Low at session open.
Throughout the session, it updates those extremes in real time and locks them on session close.
Interaction Layer
When price reaches or sweeps a session High/Low near a daily level (e.g., within your chosen tolerance), the confluence becomes visually obvious.
Traders can then decide whether it’s a likely liquidity grab (fade/reversal idea) or a continuation through the pool (breakout idea), per their plan.
How to use it
Identify session context: Start by noting where price is trading relative to the current session’s High/Low.
Locate nearby daily liquidity: Check distance to PDH/PDL, prior open/close, and weekly extremes.
Look for confluence:
Sweep-and-fade idea: Session High swept into PDH (or Session Low into PDL) with failure to hold → potential reversal context.
Break-and-go idea: Strong close through PDH/PDL following a session extreme break → potential continuation context.
Risk framing: Session High/Low and PDH/PDL provide objective anchors for stops and targets. Adapt to your own risk model (e.g., use ATR or structure-based stops).
Keep it clean: Use this as your primary overlay to avoid clutter; add confirmations (volume, structure) only if they genuinely help your process.
Settings (typical options)
Sessions: Choose which sessions to display (e.g., Asia/London/NY) and their time zones/hours.
Daily Levels: Toggle PDH/PDL, prior open/close, prior week High/Low, and other references you rely on.
Visuals: Colors, line styles, label visibility, and optional band shading for quick recognition.
Confluence Tolerance (optional): Define how near a session extreme must be to a daily level to consider it a “liquidity touch/sweep” in your visuals.
Alerts (optional): First touch/sweep of session High/Low, break/close beyond PDH/PDL, or custom distance conditions.
Chart & Publishing Notes (for reviewers and users)
Clean chart by design: Only essential lines/labels for session extremes and daily references.
Plain-English description: Explains what, why, and how so non-coders can use it confidently.
Original integration: The value here is the purposeful interaction—seeing session sweeps in context of daily liquidity in one place—rather than a cosmetic mashup.
Limitations & good practice
This tool is contextual, not predictive. It highlights structure and liquidity landmarks; trade decisions are yours.
Session definitions vary by asset/exchange; ensure your session times match your market.
Past behavior at these levels does not guarantee future outcomes; always use proper risk management.
Disclaimer
This indicator is for educational and informational purposes only and is not financial advice. Trading involves risk; always test and evaluate with your own methods and risk parameters.
This indicator provides a single, clean view of two core intraday contexts that day traders rely on:
Daily Liquidity Levels: prior day high/low (PDH/PDL), prior day open/close, weekly highs/lows, and other commonly referenced reference points.
Session Ranges: clearly plotted high/low for each active session (e.g., Asia, London, New York), tracked live as the session evolves.
By unifying these two information layers, traders can immediately see when price is sweeping a session’s extremes into known daily liquidity—a frequent precursor to reversals or continuation moves. This saves chart space, reduces cognitive overload, and turns two separate checks into one coherent read.
What it does
Plots daily liquidity references: previous day high/low, previous day open/close, and optional higher-timeframe levels (open, high, mid and low 4H ,Day, Week, month, year and quarterly).
Tracks session high/low live: as each session unfolds, the indicator updates that session’s running High and Low, then locks them at session end.
Maps interaction between the two layers: you can instantly spot session sweeps that tag PDH/PDL (or weekly extremes), highlight potential liquidity grabs, and frame risk with objective boundaries.
Keeps the chart clean: just essential lines/zones and concise labels—no extra clutter.
Why it’s useful & original
Single-purpose integration: Rather than a generic mashup, this is a purpose-built fusion where session dynamics are read in the context of daily liquidity. That relationship is the core edge—seeing when a session sweep aligns with known liquidity pools.
Workflow efficiency: One overlay replaces two indicators, simplifying visibility and reducing conflicting visuals.
Decision clarity: The combination highlights setups many intraday traders already watch manually (e.g., NY session high sweep into PDH), but makes them obvious in real time.
How it works (plain-English logic)
Daily Liquidity Engine
At the start of each day, the indicator records PDH, PDL, prior open/close and (optionally) prior week high/low.
These levels are plotted and extended across the session as static references.
Session Range Tracker
For each defined session (e.g., Asia/London/New York), the script initializes session High/Low at session open.
Throughout the session, it updates those extremes in real time and locks them on session close.
Interaction Layer
When price reaches or sweeps a session High/Low near a daily level (e.g., within your chosen tolerance), the confluence becomes visually obvious.
Traders can then decide whether it’s a likely liquidity grab (fade/reversal idea) or a continuation through the pool (breakout idea), per their plan.
How to use it
Identify session context: Start by noting where price is trading relative to the current session’s High/Low.
Locate nearby daily liquidity: Check distance to PDH/PDL, prior open/close, and weekly extremes.
Look for confluence:
Sweep-and-fade idea: Session High swept into PDH (or Session Low into PDL) with failure to hold → potential reversal context.
Break-and-go idea: Strong close through PDH/PDL following a session extreme break → potential continuation context.
Risk framing: Session High/Low and PDH/PDL provide objective anchors for stops and targets. Adapt to your own risk model (e.g., use ATR or structure-based stops).
Keep it clean: Use this as your primary overlay to avoid clutter; add confirmations (volume, structure) only if they genuinely help your process.
Settings (typical options)
Sessions: Choose which sessions to display (e.g., Asia/London/NY) and their time zones/hours.
Daily Levels: Toggle PDH/PDL, prior open/close, prior week High/Low, and other references you rely on.
Visuals: Colors, line styles, label visibility, and optional band shading for quick recognition.
Confluence Tolerance (optional): Define how near a session extreme must be to a daily level to consider it a “liquidity touch/sweep” in your visuals.
Alerts (optional): First touch/sweep of session High/Low, break/close beyond PDH/PDL, or custom distance conditions.
Chart & Publishing Notes (for reviewers and users)
Clean chart by design: Only essential lines/labels for session extremes and daily references.
Plain-English description: Explains what, why, and how so non-coders can use it confidently.
Original integration: The value here is the purposeful interaction—seeing session sweeps in context of daily liquidity in one place—rather than a cosmetic mashup.
Limitations & good practice
This tool is contextual, not predictive. It highlights structure and liquidity landmarks; trade decisions are yours.
Session definitions vary by asset/exchange; ensure your session times match your market.
Past behavior at these levels does not guarantee future outcomes; always use proper risk management.
Disclaimer
This indicator is for educational and informational purposes only and is not financial advice. Trading involves risk; always test and evaluate with your own methods and risk parameters.
Mã được bảo vệ
Tập lệnh này được đăng dưới dạng mã nguồn đóng. Tuy nhiên, bạn có thể sử dụng tự do và không giới hạn – tìm hiểu thêm tại đây.
Thông báo miễn trừ trách nhiệm
Thông tin và các ấn phẩm này không nhằm mục đích, và không cấu thành, lời khuyên hoặc khuyến nghị về tài chính, đầu tư, giao dịch hay các loại khác do TradingView cung cấp hoặc xác nhận. Đọc thêm tại Điều khoản Sử dụng.