PROTECTED SOURCE SCRIPT
Cập nhật Liquidation Heatmap
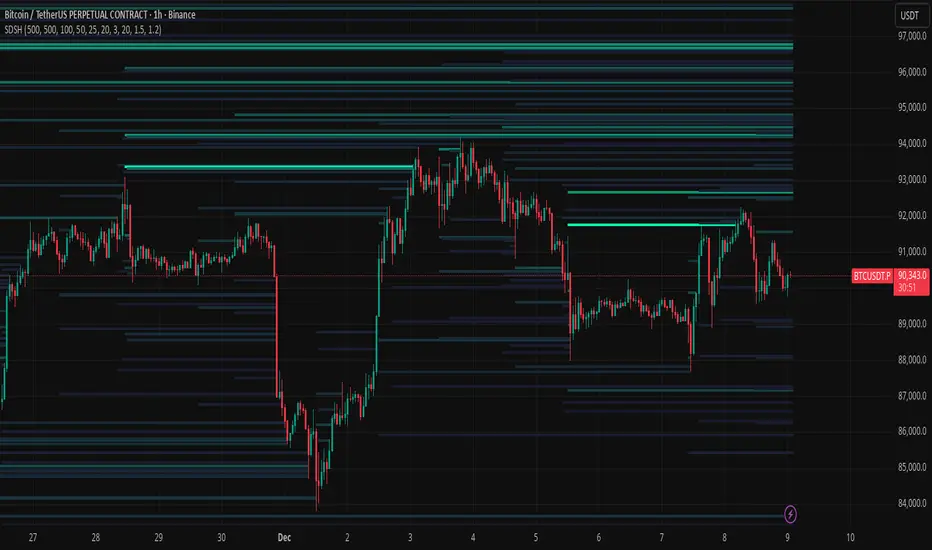
SDSH Liquidation Heatmap: Stochastic Microstructure Modeling
Technical Summary
This indicator implements an advanced algorithmic approach for the detection of liquidity and liquidation zones using the State-Dependent Spread Hawkes (SDSH) model. Unlike conventional heatmaps that aggregate raw Ask/Bid and Open Interest (OI) data from external data providers, this script generates a synthetic liquidity topology based purely on the physics of price movement and market microstructure.
Scientific Foundation: The SDSH Model
The core of the indicator relies on two integrated mathematical components that allow for the inference of latent order locations without reading the Limit Order Book (LOB):
High-Fidelity Replication without Level 2 Data
The critical value of this indicator lies in its ability to replicate with spatial exactitude the zones that a Liquidation Heatmap based on Tick-level or real market depth data would signal, but operating in a "black box" environment regarding provider data.
By triangulating volatility, temporal intensity decay (Hawkes Decay), and standard leverage projections (100x, 50x, 25x), the algorithm reconstructs the liquidation map. Mathematically, real liquidation zones are a function of participant entry and subsequent volatility; by modeling these variables accurately, the visual result converges with the actual location of stop-losses and mass liquidation points.
Utility for Quantitative Modeling (Quants)
This tool is designed for research and quantitative trading environments that require:
Visual Parameters
The indicator renders "stress boxes" with opacity gradients based on the probability of price collision.
Technical Summary
This indicator implements an advanced algorithmic approach for the detection of liquidity and liquidation zones using the State-Dependent Spread Hawkes (SDSH) model. Unlike conventional heatmaps that aggregate raw Ask/Bid and Open Interest (OI) data from external data providers, this script generates a synthetic liquidity topology based purely on the physics of price movement and market microstructure.
Scientific Foundation: The SDSH Model
The core of the indicator relies on two integrated mathematical components that allow for the inference of latent order locations without reading the Limit Order Book (LOB):
- State-Dependent Spread Estimation: It uses variations of range-based volatility estimators (based on Corwin-Schultz principles) to calculate the "effective spread" of the market in real-time. This allows determining the actual price friction and, consequently, where leveraged positions are statistically likely to accumulate.
- Self-Exciting Hawkes Processes: A stochastic point process model (Hawkes Process) is applied to measure the "intensity" of liquidity events. The algorithm assumes that order arrivals and volatility cluster in time; the model quantifies this market "memory" to project the future intensity of liquidations.
High-Fidelity Replication without Level 2 Data
The critical value of this indicator lies in its ability to replicate with spatial exactitude the zones that a Liquidation Heatmap based on Tick-level or real market depth data would signal, but operating in a "black box" environment regarding provider data.
By triangulating volatility, temporal intensity decay (Hawkes Decay), and standard leverage projections (100x, 50x, 25x), the algorithm reconstructs the liquidation map. Mathematically, real liquidation zones are a function of participant entry and subsequent volatility; by modeling these variables accurately, the visual result converges with the actual location of stop-losses and mass liquidation points.
Utility for Quantitative Modeling (Quants)
This tool is designed for research and quantitative trading environments that require:
- Data Independence: Elimination of the need for expensive subscriptions to Open Interest or Depth of Market (DOM) data.
- Noise Filtering: As a mathematical model, it filters out "spoofing" (fake orders in the book) that often clutters traditional heatmaps, showing only zones where market structure mathematically forces the existence of liquidity.
- Structural Backtesting: It allows for the validation of mean reversion and liquidity breakout strategies on historical data where market depth information is often unavailable or unreliable.
Visual Parameters
The indicator renders "stress boxes" with opacity gradients based on the probability of price collision.
- Colors: Map the density of estimated synthetic contracts.
- Persistence: Zones remain active until the price interacts with them (absorption) or the model determines that liquidity has dissipated (Hawkes decay).
Phát hành các Ghi chú
SDSH Liquidation Heatmap: Stochastic Microstructure & VSA ModelingTechnical Summary
This indicator implements an advanced algorithmic approach for the detection of liquidity and liquidation zones using the State-Dependent Spread Hawkes (SDSH) model, now reinforced with Volume-Spread Analysis (VSA) logic. Unlike conventional heatmaps that aggregate raw Ask/Bid and Open Interest (OI) data from external data providers, this script generates a synthetic liquidity topology based purely on the physics of price movement, volumetric effort, and market microstructure.
Scientific Foundation: SDSH & VSA Integration
The core of the indicator relies on three integrated mathematical components that allow for the inference of latent order locations without reading the Limit Order Book (LOB):
- State-Dependent Spread Estimation: It uses variations of range-based volatility estimators (based on Corwin-Schultz principles) to calculate the "effective spread" of the market in real-time. This allows determining the actual price friction and, consequently, where leveraged positions are statistically likely to accumulate.
- Self-Exciting Hawkes Processes: A stochastic point process model (Hawkes Process) is applied to measure the "intensity" of liquidity events. The algorithm assumes that order arrivals and volatility cluster in time; the model quantifies this market "memory" to project the future intensity of liquidations.
- VSA Macrostructure Weighting (Alpha Extract Logic): The model now incorporates a vector that correlates Volume with Price Range (Effort vs. Result). This differentiates between passive absorption (high volume, low range) and aggressive displacement (high volume, wide range). By weighting the synthetic Open Interest against price expansion, the algorithm filters out "churn" and identifies only the structural breakouts that mathematically trap offside traders.
High-Fidelity Replication without Level 2 Data
The critical value of this indicator lies in its ability to replicate with spatial exactitude the zones that a Liquidation Heatmap based on Tick-level or real market depth data would signal, but operating in a "black box" environment regarding provider data.
By triangulating volatility, temporal intensity decay (Hawkes Decay), and standard leverage projections (100x, 50x, 25x), the algorithm reconstructs the liquidation map. The addition of VSA logic ensures that only high-conviction zones—backed by aggressive market participation—are rendered, significantly reducing noise compared to standard OI estimation models.
Utility for Quantitative Modeling (Quants)
This tool is designed for research and quantitative trading environments that require:
- Data Independence: Elimination of the need for expensive subscriptions to Open Interest or Depth of Market (DOM) data.
- Structural Filtering: As a mathematical model, it ignores "spoofing" (fake orders) and wash trading. The VSA filter ensures that displayed levels represent genuine capital commitment and stress.
- Deep History Backtesting: With an increased storage capacity of 500 levels, it allows for the validation of mean reversion and liquidity breakout strategies on historical data where market depth information is often unavailable or unreliable.
Visual Parameters
The indicator renders "stress boxes" with opacity gradients based on the probability of price collision.
- Colors: Map the density of estimated synthetic contracts, dynamically adjusted by the VSA activity ratio.
- Persistence: Zones remain active until the price interacts with them (absorption) or the model determines that liquidity has dissipated (Hawkes decay).
Mã được bảo vệ
Tập lệnh này được đăng dưới dạng mã nguồn đóng. Tuy nhiên, bạn có thể sử dụng tự do và không giới hạn – tìm hiểu thêm tại đây.
Thông báo miễn trừ trách nhiệm
Thông tin và các ấn phẩm này không nhằm mục đích, và không cấu thành, lời khuyên hoặc khuyến nghị về tài chính, đầu tư, giao dịch hay các loại khác do TradingView cung cấp hoặc xác nhận. Đọc thêm tại Điều khoản Sử dụng.