OPEN-SOURCE SCRIPT
VWMA Crosses
This is a simple tool that gives traders a simple visual representation of Volume-Weighted Moving Average ( VWMA ) crossovers that is pretty similar to the MACD . We don't typically trade solely based on the VWMA , but it is definitely one of our go-to tools when combining multiple indicators.
When trading with VWMA's, it is common to enter a position when the fast VWMA crosses over the slow VWMA . In other words, the fast VWMA was previously less than the slow VWMA and is now greater in value than the slow VWMA . Conversely, traders often exit their positions when the fast VWMA crosses under the slow VWMA .
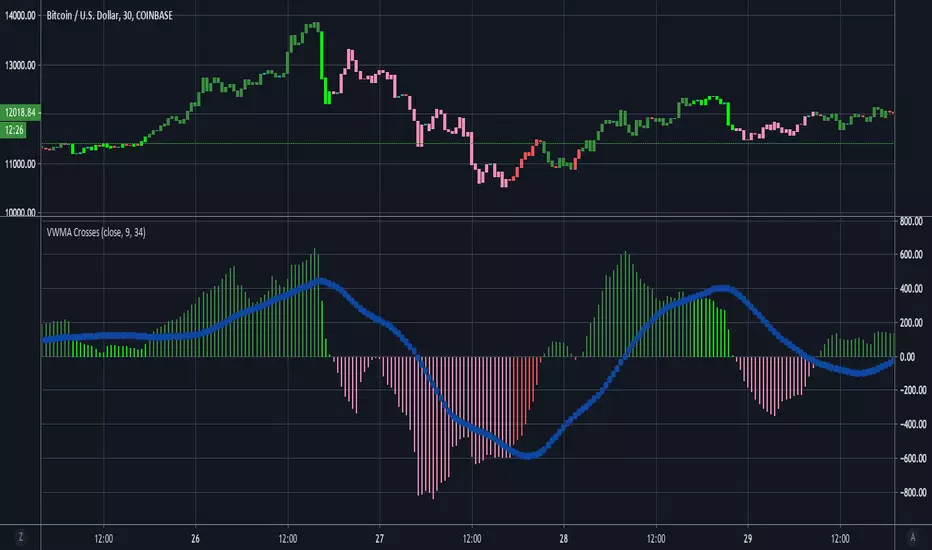
This tool plots the absolute value of the difference between the fast and slow VWMA's as a histogram. When the difference between the fast and slow VWMA's is greater than zero (meaning fast > slow), then the bars are green. The bars then turn red when the fast VWMA is less than the slow VWMA . The blue circle-line is a Simple Moving Average of the difference between the two lines.
Here's a quick guide to interpreting the chart:
if (fast VWMA > slow VWMA ) and (difference < sma of differences)
then color = lime green
if (fast VWMA > slow VWMA ) and (difference > sma of differences)
then color = dark green
if (fast VWMA < slow VWMA ) and (difference < sma of differences)
then color = light red
if (fast VWMA < slow VWMA ) and (difference > sma of differences)
then color = dark red
~Happy Trading~
When trading with VWMA's, it is common to enter a position when the fast VWMA crosses over the slow VWMA . In other words, the fast VWMA was previously less than the slow VWMA and is now greater in value than the slow VWMA . Conversely, traders often exit their positions when the fast VWMA crosses under the slow VWMA .
This tool plots the absolute value of the difference between the fast and slow VWMA's as a histogram. When the difference between the fast and slow VWMA's is greater than zero (meaning fast > slow), then the bars are green. The bars then turn red when the fast VWMA is less than the slow VWMA . The blue circle-line is a Simple Moving Average of the difference between the two lines.
Here's a quick guide to interpreting the chart:
if (fast VWMA > slow VWMA ) and (difference < sma of differences)
then color = lime green
if (fast VWMA > slow VWMA ) and (difference > sma of differences)
then color = dark green
if (fast VWMA < slow VWMA ) and (difference < sma of differences)
then color = light red
if (fast VWMA < slow VWMA ) and (difference > sma of differences)
then color = dark red
~Happy Trading~
Mã nguồn mở
Theo đúng tinh thần TradingView, tác giả của tập lệnh này đã công bố nó dưới dạng mã nguồn mở, để các nhà giao dịch có thể xem xét và xác minh chức năng. Chúc mừng tác giả! Mặc dù bạn có thể sử dụng miễn phí, hãy nhớ rằng việc công bố lại mã phải tuân theo Nội Quy.
-Profit Programmers
profitprogrammer.com
profitprogrammer.com
Thông báo miễn trừ trách nhiệm
Thông tin và các ấn phẩm này không nhằm mục đích, và không cấu thành, lời khuyên hoặc khuyến nghị về tài chính, đầu tư, giao dịch hay các loại khác do TradingView cung cấp hoặc xác nhận. Đọc thêm tại Điều khoản Sử dụng.