PROTECTED SOURCE SCRIPT
Crypto Market Breadth EMA20 [INVESTIC]
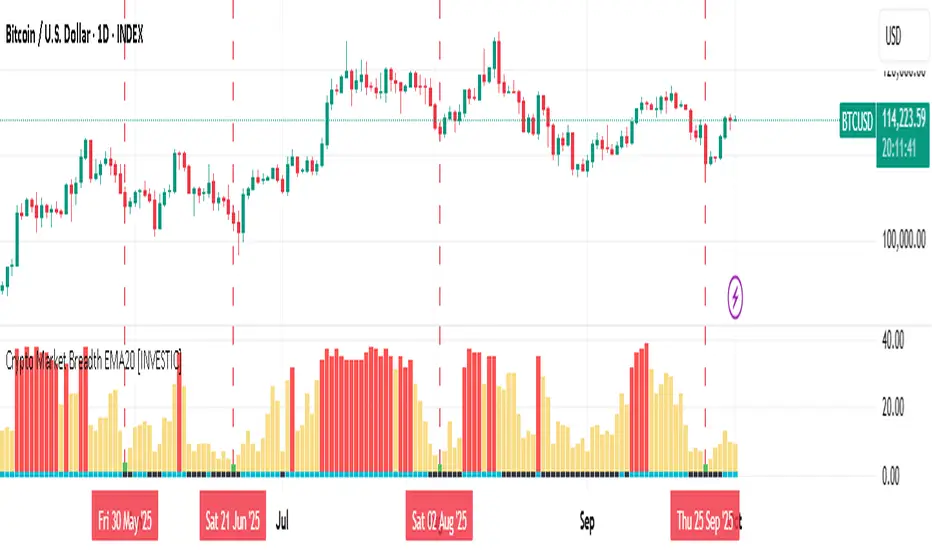
This indicator is designed to provide a broad overview of the cryptocurrency market’s health by measuring how many of the top 40 crypto assets are trading above a user-selected moving average (MA). Instead of focusing on just Bitcoin, it evaluates the market as a whole, making it useful for spotting market extremes such as panic-driven selloffs or overheated rallies.
The concept is inspired by Market Breadth Analysis often used in stock markets, but here it is specifically adapted to the crypto space, offering traders a unique perspective on overall sentiment and strength.
How to Interpret the Indicator
The indicator consists of two main components:
Main Histogram (Market Breadth)
Bottom Line (Bitcoin’s Position)
1. Main Histogram (Market Breadth)
🟢 Green Bars: Triggered when fewer than 5 cryptocurrencies are trading above their MA. This often reflects a Panic Sell situation, where extreme fear dominates the market. Such capitulation zones historically provide higher probabilities of price rebounds in both Bitcoin and altcoins.
🔴 Red Bars: Triggered when 32 or more cryptocurrencies trade above their MA. This suggests the market is becoming overheated, with most assets already in strong rallies. While this may confirm a strong bullish trend, it can also indicate a potential market top and serves as a cautionary signal.
🟡 Yellow Bars: Represent neutral or consolidating market conditions.
2. Bottom Line (Bitcoin’s Position)
🔵 Aqua: Bitcoin is above the selected MA.
⚫️ Black: Bitcoin is below the selected MA.
This additional layer helps traders align Bitcoin’s individual trend with the broader crypto market condition.
Customization and Settings
This indicator is fully customizable to suit different trading strategies:
Timeframe: Can be applied to any timeframe, from intraday to long-term charts.
Moving Average (MA): Users can select the type (EMA, SMA, WMA) and adjust the length.
For beginners, the default setting of EMA 20 is recommended as a baseline. More experienced traders are encouraged to experiment with different MA types and lengths to better match their personal strategies.
Key Advantages and Uniqueness
Unlike standard trend indicators, this tool focuses on breadth across multiple assets rather than a single price.
Adaptation of stock market breadth techniques specifically for cryptocurrencies.
Helps identify extreme conditions (capitulation or overheated rallies) that are often hidden when only looking at Bitcoin or a single indicator.
Disclaimer
This indicator is for educational and research purposes only. It does not constitute financial advice. Always perform your own analysis and risk management before making trading or investment decisions.
Mã được bảo vệ
Tập lệnh này được đăng dưới dạng mã nguồn đóng. Tuy nhiên, bạn có thể sử dụng tự do và không giới hạn – tìm hiểu thêm tại đây.
Investic
Thông báo miễn trừ trách nhiệm
Thông tin và các ấn phẩm này không nhằm mục đích, và không cấu thành, lời khuyên hoặc khuyến nghị về tài chính, đầu tư, giao dịch hay các loại khác do TradingView cung cấp hoặc xác nhận. Đọc thêm tại Điều khoản Sử dụng.