PROTECTED SOURCE SCRIPT
[DEM] Donchian Cloud
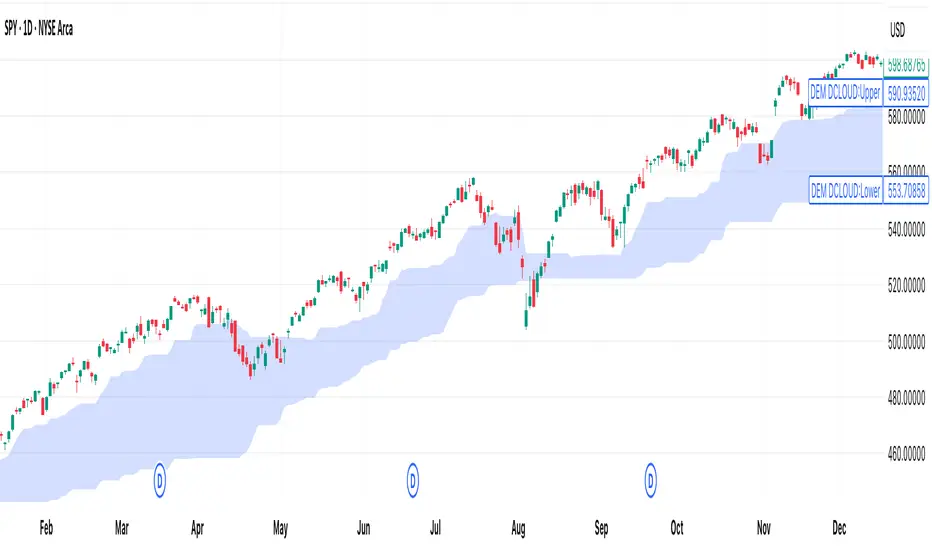
[DEM] Donchian Cloud is designed to create a visual cloud overlay on the price chart using two Donchian Channel midlines of different periods (26 and 117 bars) to identify trend direction and potential support/resistance zones. The indicator calculates the average of the highest high and lowest low for each period, plots these as nearly transparent blue lines, and fills the area between them with a color-coded cloud that changes from blue to red when the longer-period midline (117) crosses above the shorter-period midline (26), indicating a potential bearish shift in the longer-term trend. This cloud system helps traders visualize the relationship between short-term and long-term price equilibrium levels, with the cloud color providing a quick reference for overall trend bias and the cloud boundaries offering dynamic support and resistance levels.
Mã được bảo vệ
Tập lệnh này được đăng dưới dạng mã nguồn đóng. Tuy nhiên, bạn có thể sử dụng tự do và không giới hạn – tìm hiểu thêm tại đây.
Thông báo miễn trừ trách nhiệm
Thông tin và các ấn phẩm này không nhằm mục đích, và không cấu thành, lời khuyên hoặc khuyến nghị về tài chính, đầu tư, giao dịch hay các loại khác do TradingView cung cấp hoặc xác nhận. Đọc thêm tại Điều khoản Sử dụng.