FOREX Master Pattern Trend Finder by nnamdertWhat does this Indicator do?
This indicator works by identifying Trends and "potential" shifts in trends before they happen. It is technically a momentum indicator that watches for specific Bullish or Bearish momentum (i.e. Bull Runs, and Crashes).
How does it do this?
It uses a custom script that takes into account extremes in price and certain moving averages and other accurate forward looking indicators. Once it finds a Bull run, signals are triggered in the form of PLUS signs. It does the same for strong Bearish trends. Based on how the script is configured, the Indicator is able to spot (in advance) unique movement in the trend that can predict a change in momentum prior to the change occurring.
These momentum changes can be configured as alerts.
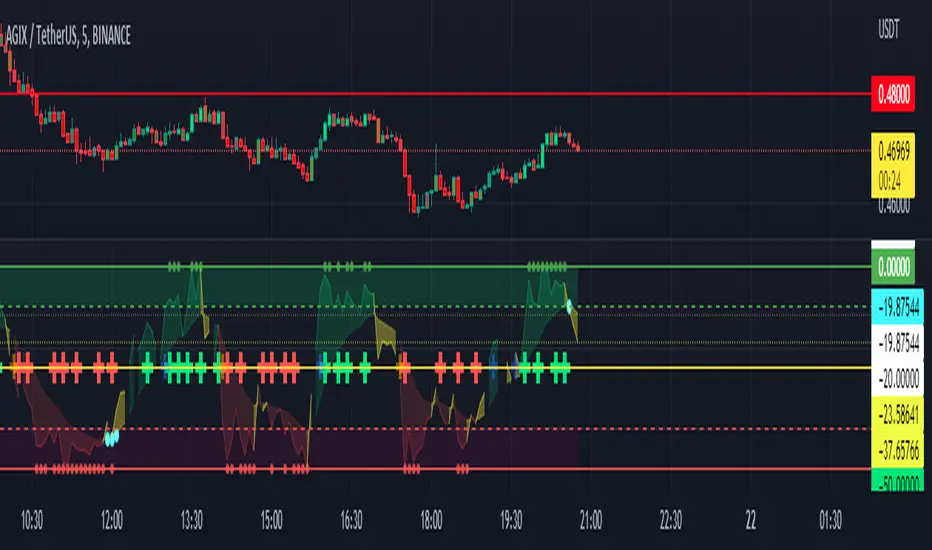
As seen in the screenshot below the indicator triggers "early warning" signals when it detects a specific movement that is indicative of a potential change in momentum or trend. It does this IN ADVANCE of any change - it is ONLY A PREDICTION but allows the trader to look at the asset to determine if the potential change in trend is valid and gives the trader enough time to set up a trade and stop-loss.
As seen in the screenshot below color-coded candles allow the trader to visually SEE the change on the chart making it easier to get a quick glance at the current trend. In addition, Green and Red Crosses were added to the oscillator to help easily identify trends if the color coded candle feature is turned OFF. These Red and Green Crosses are not located at every highlighted bar location, rather, at the first bar that the alert was triggered on. If there was a gap in the trend, the alert triggers, and plots again when a new trend starts.
As seen in the screenshot below, when a strong trend is present in either direction, small red or green dots are plotted on the oscillator. This makes spotting past and current trends much easier. Even if the price is not moving up or down, this indicates strong underlying buying or selling pressure.
Some traders like using indicators as a reversal finder. Although this indicator is NOT A REVERSAL INDICATOR, I added a signal that can be used as a "potential" reversal finder. You can see this in the screenshot below.
These "reversal" signals typically appear prior to a move in the opposite direction (but not always). A stop-loss can be set at the high or low of the previous bar depending on direction.
At times, multiple "conflicting" warning signals appear back-to-back. This is indicative of a "crab" in the market. Basically, indecision is present in the market. These "early warning" signals are smaller and either BLUE or ORANGE . Once a trend is recognized, the signal will be either RED or GREEN and a bit larger.
Viewing a higher timeframe will allow Forex Master Pattern traders to easily spot contraction zones. I manually draw the lines in at these zones. These "Value Lines" are typically respected in the future. As shown in the screenshot below, the level acted as support in the future and a newer value line was created at a "higher level" - this indicates a Bullish momentum in price as buyers and sellers have agreed upon the higher price as a true value area.
As seen in the screenshot below, multiple potential reversal signals plotted on the chart indicate a "weakening' in the strength of the current trend. This allows the trader to strategically move their stop-loss or simply take some profits off the table at this level.
This Indicator does NOT overlay on the current chart but allows the trader to see color coded bars. Simply double clicking within the indicator will expand the indicator to full screen, and double clicking within the chart itself will hide the secondary pane but keep the candles visible on the chart.
Happy Trading and GOOD LUCK!
[b]forex
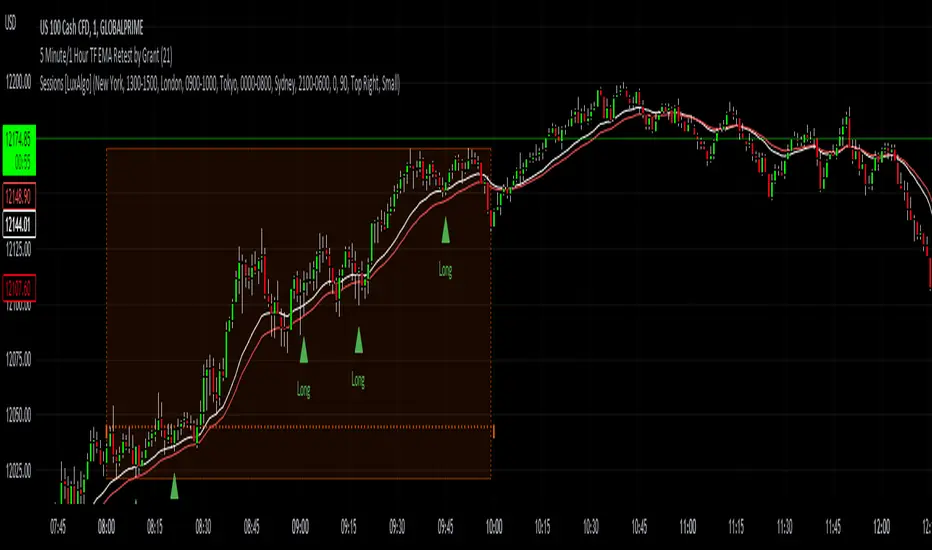
5 Minute TF 200 EMA Retest by Grantwww.tradingview.com
This indicator is a simple script meant to find retests on the 200 period moving average. It's current state is optimized for the 5 minute timeframe.
This works in all markets and all timeframes as long as you adjust certain rules for higher timeframes.
It's strengths and weaknesses
- Good at trend continuation in strong markets
- Bad in ranging markets (not surprising)
How does it work?
- It first identifies an overall trend by using the 200 ema.
- For long positions, it waits for price to close below the 200 ema, and then shortly closing back above the ema. For short positions its the opposite.
- For lower timeframes there are some other factors that help filter out bad signals that include:
- Makes sure that volume is increasing.
- Makes sure that volume is higher than average volume.
- For higher timeframes, the more specific factors aren't required.
How to use this indicator:
- Green triangles mean long positions
- Red triangles mean short positions
- Always trade with stoplosses and never risk too much of your account, please practice proper risk managment.
DISCLAIMER: Trading is inherently dangerous and carries lot's of risk. What you decide to do with my script has nothing to do with me. I am not responsible for any financial gains or losses made using this script. It is important to recognize other factors in the market to make better decisions.
Expansion Finder by nnamWhat this Indicator Does
This indicator helps the trader locate expansion and contraction areas in an easy visual way.
When the asset moves from a contraction phase into an expansion phase, the bars change color (customizable). This allows the trader to recognize areas of contraction and avoid trading them. Once a Bar Range moves outside of the average range as specified by the user, the bar will change color informing the trader that the current bar and by default the market, is moving into an expansion phase from a contraction phase.
The indicator works well for those traders that use the Forex Master Pattern to locate Value Lines and Value Areas on the chart giving them an opportunity to draw in these areas with ease.
As shown in the screenshot below, the boxes are manually drawn after the trader locates an easily identifiable area of contraction.
The Indicator makes it easy to find longer areas of contraction and ignore the noise of smaller contractions.
Customizable Settings allow the trader to define the lookback range that determines the number of bars to base the average.
A "multiplier" setting allows the trader to easily adjust the Average by changing the average using a simple calculation.
Example, if the average multiplier is set to "1", the average will be used.
Using the standard average is not always the best way to define these contractions, so traders can set the average to a higher or lower number by using the multiplier, thus changing the calculation but maintaining a consistent number across the chart.
Example: If the average is not plotting the contraction correctly, the trader can manually adjust the multiplier down to 0.5 thus adjusting the average in half or increase the multiplier to 2 thus doubling the average.
As seen in the screenshot below, this changes the number of expansion bars visible on the chart.
Below you can see Value Areas and Value Lines drawn in. These lines assist the trader in defining important levels for future trading.
I hope this Indicator helps you locate value areas and value lines on charts in an easy way.
Any questions or concerns or suggestions, please do not hesitate to reach out.
Happy Trading !!!!
FlashTrade 20 Asset ScreenerThe FlashTrade 20 Asset Screener is a powerful screening tool written in Pinescript and designed for use in Tradingview. It simultaneously monitors a combination of seven (7) lagging and three (3) leading indicators for twenty (20) assets, such as; stocks, cryptocurrencies, or forex pairs.
The screener sends summarized numeric data as an alert to external programs that specialize in automated trading. This proprietary technology developed by the algorithmic trading firm known as FlashTrade.AI is now integrated with the rules-based trading platform TradeLab.AI.
The lagging indicators tracked by the screener are as follows:
1. The 8 Period Exponential Moving Average (8EMA): It determines whether it is over or under the 21 Period Exponential Moving Average (21EMA).
2. Two Closes of the 8 Period Exponential Average (8EMA): This confirms a trend as either bullish or bearish when it occurs over or under the 21 Period Exponential Moving Average (21EMA).
3. Ichimoku Cloud: This indicator identifies whether the price is above or below the cloud, indicating bullish or bearish trends.
4. Ichimoku Cloud: Conversion Line Above Base or Conversion Line Below Base: This measures the trend strength based on the distance between the conversion line and the base line.
5. Ichimoku Cloud: Lag Line Above Price or Lag Line Below Price: This tracks the lag line's position relative to the current price to confirm trend direction.
6. Ichimoku Cloud: Leading Cloud Green or Leading Cloud Red: This identifies the trend based on the color of the leading cloud.
7. MACD: This oscillator tracks the difference between two exponential moving averages and helps identify bullish or bearish momentum in the market.
The screener also tracks three leading indicators that primarily measure trading volume and momentum. These leading indicators are:
1. The Relative Strength Index (RSI): This oscillator measures the speed and change of price movements to identify overbought or oversold conditions in the market.
2. The Stochastic: This oscillator measures the momentum of price movements and helps identify potential trend reversals in the market.
3. The relative Vigor Index (RVGI): This indicator measures the strength of price movements by comparing the closing price to the trading range and helps identify trend reversals.
Overall, the FlashTrade 20 Asset Screener is a powerful tool for traders looking to automate their trading strategies. By monitoring multiple indicators for multiple assets simultaneously, it can identify trends and capitalize on opportunities when they present themselves.

Customizable Moving Average RibbonThis indicator is a highly customizable moving average ribbon with some unique features.
This script can utilize multiple unique sources, including a non-repainting renko closing price. Renko charts focus solely on price movement and minimize the impacts of time and the extra noise time creates. Employing the renko close helps smooth out the MA ribbon. Insignificant price movements will not cause a change in the plotted lines of the indicator unless a new threshold is breached or a "brick" is created. This is highly useful for quickly identifying consolidation areas or overall flat price movement.
There are two methods for selecting the box size when utilizing the renko source. Box size is critical for the overall function and efficacy of the plots you will visually see with this indicator. Box size is set automatically using the Average True Range "ATR" or manually using the "Traditional" setting. The simplest way to determine a manual box size is to take the ATR of the given instrument and round it to the nearest decimal place. As an example, if the ATR for the asset is 0.18, you would round that number to 0.2 and utilize this as your traditional box size.
The MA ribbon contains eleven adjustable moving average lines. Users can choose to turn off as many as they would like. Users can also adjust the length of the individual moving averages and the source for all moving averages. There are nine types of moving averages to choose from for the ribbon. The MA options are:
Exponential Moving Average = 'EMA'
Double Exponential Moving Average= 'DEMA'
Triple Exponential Moving Average = 'TEMA'
Simple Moving Average = 'SMA'
Relative Moving Average = 'RMA'
Volume Weighted Moving Average = 'VWMA'
Weighted Moving Average = 'WMA'
Smoothed Simple Moving Average = 'SSMA'
Hull Moving Average = 'HULL'
We believe that the ribbons features, including the line color change, help quickly identify trends and give users optimum customization. Users can select from five different color schemes including:
Green/Red
Purple/White
White/Blue
Silver / Orange
Teal/ Orange

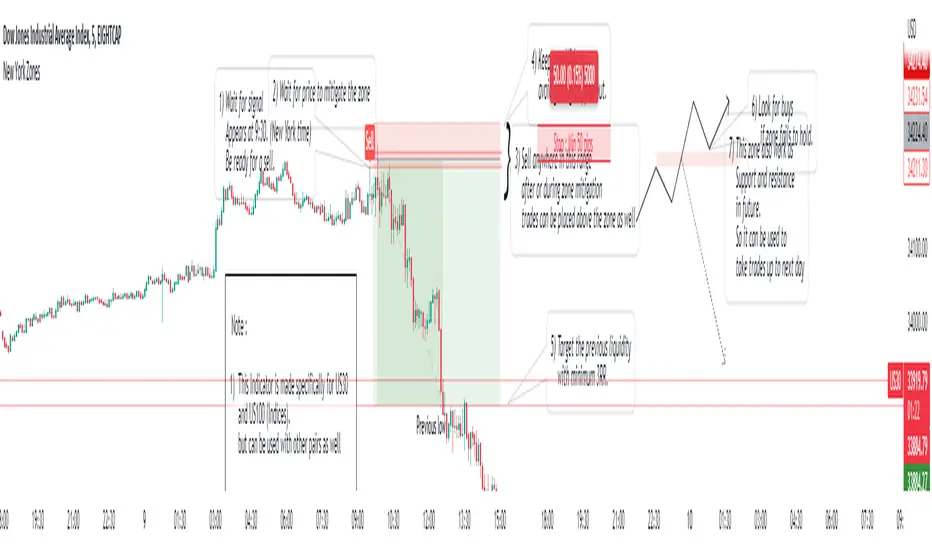
New York ZonesHello traders, here is a indicator which is based on a strategy I found on a forum. I hope you will find it useful.
Rules to Follow:
1) Wait for signal . Signal appears at 9:30. (New York time)
2) Wait for price to mitigate the zone
3) Sell anywhere in this range after or during zone mitigation.
4) Keep stop Wide to avoid getting stopped out.
5) Target the previous liquidity with minimum 3RR.
6) Look for opposite trade if zone fails to hold , with proper analysis
Note :
1) This Indicator is made specifically for US30 and US100 (Indices) but can be used with other pairs as well (need back testing)
2) I would not recommend to place the trade right away as soon as signal appears , wait for liquidity to be taken out and place a trade after confirmation.
3) Trades can be placed below the zone as well but the probability of entry may decrease ,while increasing the accuracy.
4) Use timeframe <= 5 min to take entries.
Trade scenarios
Perfect trade :
Price failed to hold, you got stopped out and market changes direction :
Price respect zone in future:
Encounters Pro - Free versionThe Encounters Pro indicator is a general-purpose tool to improve the capacity of forecasting future market price moves.
This free version has one engine active and a second engine partially active between 15h and 17h UTC.
This indicator does not provide buy, sell or hold signals ; instead, it helps to determine the future direction of prices .
How to read it:
The engines must be tracked from bottom to the top. Red color is bearish or descending and green color is bullish or ascending. The upper engine (line) is the one that represents the immediate price direction, take it into consideration.
When two or more consecutive engines change, sequentially, from bottom to top, and they have, after this process, the same color, it may indicate that price is about to move in that direction. However, that is not enough, the trend must be already present or you must have a sound technical reason to validate the idea provided by the Encounters Pro indicator.
There are four examples on the image above.
Case 1 is a valid signal because the three upper engines changed from red to green, from bottom to top: firstly the third one, then the second one and, finally, the first one on top.
Case 2 would not be a valid singnal considering that the third engine was red before the first one turned green. However, it was a valid bullish signal because the fourth level was green before the second and the first.
Case 3 is not a valid signal because the first engine is green and the rest are red.
Case 4 is not a valid signal because the sequence goes from top to bottom and it is mandatory that the sequence goes from the bottom or lower engines to the ones on top.
Two engines switching color at the same time are valid. This is the only exception to the bottom to top rule.
The engines
The first one (the top one) leads the rest from the temporal perspective, but it is the weaker one. The sencond and rest of lines, to the bottom, reflect an increasing directional strength, and may represent deeper effects on market prices. You will have to carefully examine the chart, with historical data, and observe how price reacts as you spot different patterns among the engines of the Encounter Pro indicator.
On the main image above, the green arrows show a clear bullish tendency upon London Markets open time, for instance.
The slope and the engine position
The lines should be considered in terms of their slope and position. An ascending line is a bullish strength signal, even if a red color temporarily appears, specially if above the middle level of the engine. When the lines are on top, it means the engine is gauging the maximum possible bullish pressure, but if the line were falling at the same time, above the middle level, the bullish implication of that engine would be significantly lower.
Conversely, when lines are either stalling or close to the bottom, it is a signal of bearish increasing power.

Market Sessions - By LeviathanA simple indicator to help you keep track of 4 market sessions (default: Tokyo, London, New York, Sydney) in 4 different visual forms (boxes, timeline, zones, colored candles) with many other useful tools.
You can choose between 4 different market sessions. The default ones are Tokyo, London, New York and Sydney but you can easily customize the times, names and colors to make the script plot any session you need. Sessions can be viewed in 4 different ways: boxes, zones, timelines, or just colored candles, all with customizable appearances. You can make your chart cleaner by merging sessions overlaps, choosing a custom lookback period and also picking between various additional settings such as viewing session High/Low or Open/Close change in % or pips, hiding weekends, viewing the Open/Close Line to identify session’s direction and 0.5 level to see session’s “Equilibrium” and much more. More updates with interesting tools will be added in the future.
Note: The script will plot the correct default Tokyo, London, New York and Sydney sessions automatically, your chart/Tradingview app timezone does not matter! If you wish to tweak the open/close times of sessions, just make sure you input them in UTC (but even this can be changed later in the settings)
Settings Overview
SESSIONS
- You can show/hide Tokyo Session, rename it, change the color and set up start/end time.
- You can show/hide London Session, rename it, change the color and set up start/end time.
- You can show/hide New York Session, rename it, change the color and set up start/end time.
- You can show/hide Sydney Session, rename it, change the color and set up start/end time.
* Keep in mind that you can fully change and customize these sessions and therefore create any other sessions or a zone you wish to display.
ADDITIONAL TOOLS AND SETTINGS
1. “Change (Pips)” - this will add the pip distance between Session High and Session Low or the pip distance between Session Open and Session Close to the session label.
2. “Change (%)” - this will add the percentage distance between Session High and Session Low or the percentage distance between Session Open and Session Close to the session label.
3. “Merge Overlaps” - this will merge the overlapping sessions and show only one at a time (end of Tokyo is moved to start of London, the end of London is moved to the start of New York, end of New York is moved to start of Sydney and end of Sydney is moved to start of Tokyo).
4. “Hide Weekends” - this will prevent the script from plotting sessions over the weekend when the markets are closed.
5. “Open/Close Line” - this will draw a line from the session open to the session close (or current price, if session is ongoing).
6. “Session 0.5 Level” - this will draw a horizontal line halfway between the session’s high and the session’s low.
7. “Color Candles” - this will color the bars/candlesticks with the color of the session in which they occurred.
8. Display Type” - Choose between three different ways of session visualization (Boxes, Zones and Candles).
9. “Lookback (Days)” - this input tells the script to only draw sessions for X days back (1 = one day).
10. “Change (%/Pips) Source) - this is where you choose the source of “Change (Pips)” and ”Change (%) ” labels. Picking “Session High/Low” will show you the change between Session High and Session Low and picking “Session Open/Close” will show you the change between Session Open and Session Close.
11. “Input Timezone” - this defines the timezone of the session start/end inputs (you don’t have to change this unless you know what you’re doing)
Make sure to read future update logs to keep track of the most recent additions and settings of this script.
Box generation code inspired by Jos(TradingCode), session box visuals inspired by @boitoki's FX Market Sessions

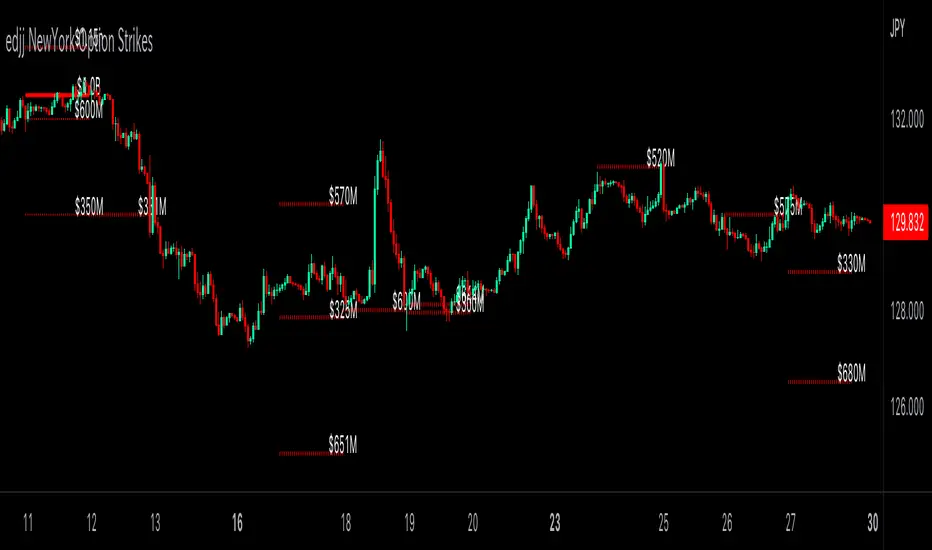
edjj NewYork Option Strikesedjj NewYork Option Strikes is a membership-only weekly issued pinescript that displays New York option strikes and their amounts, including: USDJPY , EURUSD , GBPUSD , AUDUSD , NZDUSD , USDCAD , EURGBP , etc. Over 1 billion strikes are automatically highlighted. To get access, follow the instruction below.
Commercial FV PriceTrend V1Hello Traders ,
This is a trend trading Indicator where support and resistance and demand zone has been mentioned , It plots according to the trend change . Important point of the indicator is at time when we enter , just on the bases of buy and sell we enter and most of the time market takes out our SL or market reverses or trend changes , There comes the zones part and its functionality is mentioned in the images below and entry is only confirmed only when the candle penetrates inside the any of the zone be that be Resistance zone or Demand Zone and then breaks the low of the Zone (if trend is bearish) then only one can take short position and high of the zone should be the Stoploss ... Similarly if the trend is bullish and price is between Resistance and Demand Zone , if the price breaks the resistance and continue no long position can be taken , atleast for once it should penetrates back inside the Resistance Zone and then breaks the high of the zone that time long entry will become valid and low of the zone will be the Stoploss and 1:3 Risk Reward . By the way this can work with any type of market. However I concluded Intraday levels too which can be turned off according to user comfortability along with mean channel .
Aqua defines BULLISH TREND
RED defines BEARISH TREND
Rules for exit
lONG Exit= Candle closes below Zone Low
Short Exit =Candle closes above Zone high
-----------------
Disclaimer
Copyright by FaizanNawazz.
The information contained in my scripts/indicators/strategies/ideas does not constitute financial advice or a solicitation to buy or sell any securities of any type. I will not accept liability for any loss or damage, including without limitation any loss of profit, which may arise directly or indirectly from the use of or reliance on such information.
All investments involve risk, and the past performance of a security, industry, sector, market, financial product, trading strategy, or individual’s trading does not guarantee future results or returns. Investors are fully responsible for any investment decisions they make. Such decisions should be based solely on an evaluation of their financial circumstances, investment objectives, risk tolerance, and liquidity needs.
My scripts/indicators are only for educational purposes!
Happy Trading!

GRIDBOT Scalper by nnamWhat is this Indicator used for?
Made specifically for GRID Bots
note: before continuing... this indicator works on any timeframe, but it WORKS BEST ON THE 15 MINUTE TIMEFRAME
Straters and Forex Master Pattern Value Line Traders use this to help determine when the price could reverse.
This indicator is a scalping indicator that produces signals when a "potential" reversal in price is indicated. When the price moves UP and a Potential Bearish Reversal Signal occurs, traders can use this signal as a potential SHORT entry signal for their Short Grid Bot. The process is the same in reverse. After a sustained move down, a Potential Bullish Signal can be used by the trader as a potential LONG entry signal for their GridBot.
As shown in the screenshot below, lines develop on the chart (either RED or GREEN) indicating that a sustained move in one direction is currently occurring; however, there is no potential reversal signal plotted (this means that price action is currently moving in one direction only).
As shown in the screenshot below, lines can be used as a stop-loss after entering the GRIDbot. (usually, by this time, the Grid Bot is in Profit as it usually moves in the opposite direction first)
What this Indicator Does
The GRIDBOT Scalper provides information regarding potential reversals in the market after a sustained movement in one direction (either Bullish or Bearish).
The indicator is based on PRICE-ACTION ONLY and does not take into account the current state of the market (Bullish or Bearish).
Once the price moves in a particular direction for at least 14 bars , a line appears as shown in a previous screenshot. Once the price stops moving in that direction and begins moving in the opposite direction - and after a sustained run - a "signal" appears alerting the trader that a "potential" reversal could be on the horizon soon.
If price moves in one direction and plots both a line and a signal and then begins moving back in the other direction in a sustained manner, the original signal will remain even when a NEW line begins forming (the original line will disappear). (see below) This line will continue to move as the price continues to move. Not until a signal plots on the chart is the potential reversal forming. THE LINE DOES NOT SIGNAL A REVERSAL . Some traders, however, use this information to "ride the wave UP or DOWN" and exit their positions once the signal prints.
As shown below, optional input settings allow the trader to set the line at CLOSE or HIGH/LOW of the candle preceding the potential reversal.
It is suggested to use Close instead of High or Low but the setting allows one to use either.
As shown in the screenshot below, it is typical on LOWER TIME FRAMES to see the price pass the signal line. The Indicator works best on the 15 minute timeframe, as it gives the trader time to make the decisions required as the volatility is less on the 15 minute chart vs the 1 minute or 5 minute charts.
If you have any questions or suggestions for this indicator, please join our Discord. We offer free training on this Indicator on our Discord Server.

Volume ClusterVolume Cluster aggregates one-minute-based volume information over a specified arbitrary price range as a cluster. In delta mode, the accumulated volume is displayed based on the buy volume/sell volume information.

Divergence Indicator Screener [Trading Solutions]It's been a while since the last publication on the platform. We've been studying the charts and developing some interesting strategies and indicators, so we'll be posting some ideas in the near future.
Overview
This indicator allows you to find divergences between the price action and the classic RSI. It has the ability to anticipate trend changes.
Highs and Lows are determined using Pivot Points, wich can be adjusted in settings.
You can use this indicator to find two kind of divergences, Regular and Hidden:
Regular is when price makes a higher high, but the RSI makes a lower high
Hidden is when price makes a lower high, but the RSI makes a higher high
The opposite case for Bearish Divergence
The most important functionality of this indicator is that we can be alerted when a divergence occurs in different trading pairs, without the necessity of checking different charts at the same time, and seize opportunities offered by the market. You only have to go to Alerts Tab , click on Create Alert , select Divergence Indicator Screener and wait for the Notification in your favorite device.
You can choose any ticker to be plotted on chart and even add a new one.
Settings
To get everything started with this indicator, here are the different inputs:
RSI Settings: Period y Source
Pivot Point: Left and Right lookback bars
Filter Divergences: Regular and Hidden and max and min distance from the pivot points to consider a valid divergence
Draw table and Filter how much bars to look for a divergence in the past and plot it in the table: The fewer bars, less divergences shown
We hope you can take the most of this tool, and helps improve your day to day trading. Feel free to comment and make suggestions. We will be updating soon

Forex Strength IndicatorThis indicator will display the strength of 8 currencies, EUR, AUD, NZD, JPY, USD, GBP, CHF, and CAD. Each line will represent each currency. Alongside that, Fibonacci levels will be plotted based on a standard deviation from linear regression, with customizable lengths.
For more steady Fibonacci levels, use higher lengths for both Standard Deviations and Linear Regression. All currency lines come from moving averages with options like EMA, SMA, WMA, RMA, HMA, SWMA, and Linear Regression.
When lines of the active pair are far from each other, it means higher divergence in those currency strengths among the other pairs. The closer the lines are, the lower the divergence.
You can use the Fibonacci levels as points for the reversal or end of the current trend. When the lines cross can be used as a parameter for a more accurate signal of the next movement.
All 28 pairs are loaded from the same time frame and will use the same moving average for all of them
Alerts from the line crossing are available.

FOREX MASTER PATTERN Companion ToolWhat This Indicator Does
The Forex Master Pattern uses candlesticks, which provide more information than line, OHLC or area charts. For this reason, candlestick patterns are a useful tool for gauging price movements on all time frames. While there are many candlestick patterns, there is one which is particularly useful...
The Engulfing Pattern
An engulfing pattern provides an excellent trading opportunity because it can be easily spotted and the price action indicates a strong and immediate change in direction. In a downtrend, an up candle real body will completely engulf the prior down candle real body (bullish engulfing). In an uptrend a down candle real body will completely engulf the prior up candle real body (bearish engulfing).
Used in conjunction with the FOREX Master Pattern value line, the Engulfing Pattern can assist the trader with reversal timing or trend confirmation during the expansion and trend phases.
As shown in the screenshot below. Engulfing Candles usually precede a sharp move in price in the direction of the engulfing candle.
As shown in the screenshot below, when the Show Lines option is ON while using the indicator, both red and green lines are drawn on the chart automatically when engulfing candles form. These lines are projected forward 100 bars and tend to be reliable support and resistance areas. These areas are typically hidden from view.
In addition to the Show Lines option, the indicator (by default) creates boxes around trading zones that are created when an engulfing candle is formed. (There is an option to hide these from view if desired).
As seen in the screenshot below, these areas / zones are wider than a line and encompass a resistance / support zone rather than a specific price. Liquidity is usually high in these areas and a lot of selling / buying occurs here. These zones are drawn in advance out into the future giving the trader an idea of where price will revert to eventually.
A combination of LINES and AREAS can be used giving the user a better idea of where within the zone price will go.
As seen on the screenshot below, this combination provides a pretty accurate indication of the reversal point well in advance.
As seen in the screenshot below, when a ZONE / AREA has been fully breached (crossed) by price, the area is deactivated an no longer continues forward on the chart. Until price breaches an area, it remains valid and continues on the chart until and only if it is breached by price.
The Indicator is fully customizable.
The use can change the color of the engulfing candles, the color of the zones, transparency etc. You can turn OFF or ON any of the features such as lines, zones, bar coloring, and plotted arrows.
I really hope you get value from this indicator and... HAPPY TRADING!!

Forex Lot Size CalculatorI grew very tired of opening a Forex Calculator Website in the moment I wanted to enter a trade copying and pasting the values as fast as I can to make sure my trade is the correct size like a responsible trader before I hit the buy button :') SO I put together this indicator tool to make the process faster and just better for myself. I have been using it for a bit and I have found it very helpful in my own process so I thought I should share it with the TV community.
The indicator does as it's title suggest. Simply add it to your chart follow to two prompts...Step one select your entry price. Step two select your stop loss price. The indicator will then load the position box for your trade. In the settings you can set your account balance, Risk % per trade and your risk to reward ratio. You also have the option to change the account base currency, the indicator will calculate the lots required to reflect the base currency that you have selected.
Things to note: This calculator is intended to give you a quick idea of an appropriate lot size for your desired trade there are many different factors that many influence the results of the calculations. Please take the time to review the results before entering your trades this tool is intend to add in your process; calculations are not guaranteed. The tool is for the Forex Market obviously.
For the most efficient way to deploy this tool I've found keeping it in my favorites section of my indictors is the best way to use it. I add it to the chart sets my points read the lots then remove it from the chart. You can modify the settings for the entry and stop each time and just leave the indictor on the chart however if you trade many pairs it becomes more tedious to type in manually the new price levels each time. It is far more simpler and fast to grab the tool out of the favs tab click the two points and read the result. Just remember to save your account settings ie: Balance, Risk, Base currency, etc...as the default settings of the indicator so everything is set up when you want to use it( You can save your settings at the bottom of the settings tab). I truly hope this tool helps your process. God bless and happy trading.

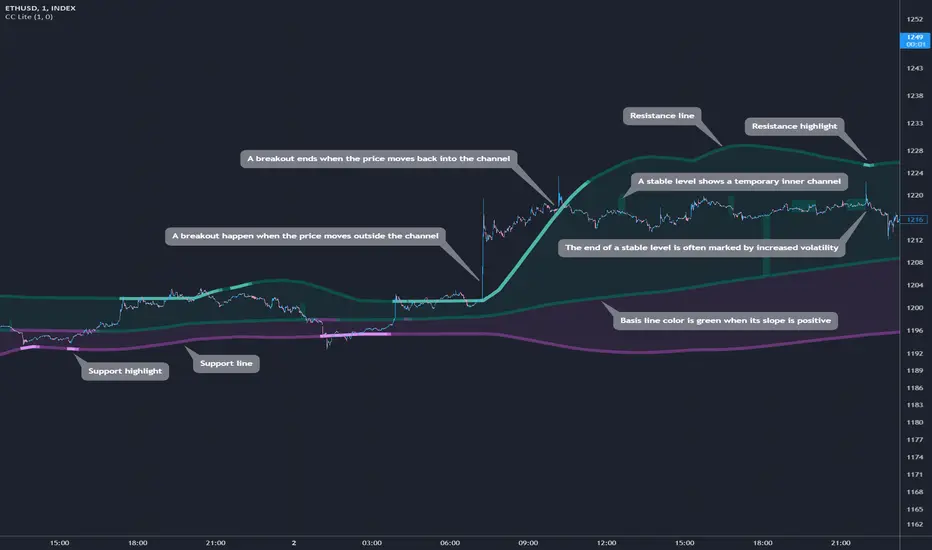
Cosmic Channel LiteCosmic Channel Lite ( CC Lite) draws dynamic non-repainting trendlines and helps
⭐ know when a breakout is about to begin
⭐ predict the position and timing of the next swing reversal
⭐ predict sudden changes in volatility
⭐ recognize whether the price is in bearish or bullish territory
👀 HOW IT WORKS
Cosmic Channel Lite draws a dynamic channel consisting of a support line, basis line and resistance line. These are calculated by applying the Reduced Median Method to groups of moving averages of different type over several periods each, effectively taking 20 data points and reducing them to 3. In between, 6 internal levels are left to give context inside the channel with stable levels, the extremes of which help highlight the SR lines (see chart). The basis line color is determined by its smoothed angle with positive angles in green and negative in purple. The aim of this indicator is to provide a consistent and generic price context that works out-of-the-box and accordingly the settings have been stripped to the bare minimum with no need to continually adjust them.
📗 HOW TO USE IT
The Cosmic Channel Lite plots are meant to be used as a guide for entering and exiting positions and setting stop-loss and take profit levels. The indicator is deemed effective for any particular timeframe as long as the price stays within the maximum bounds of the indicator's plots. For this reason it is recommended to use Cosmic Channel Lite in a multi-chart layout where each chart has a different timeframe. The 5 primary strategies are:
long when the price reverses off of the support line and short when the price reverses off of the resistance line
long when the support line is highlighted and short when the resistance line is highlighted
long when the price breaks above the resistance line and short when the price breaks below the support line
long when the price moves above the basis line after being below it for a prolonged period and visa-versa (short when the price moves below the basis line)
long/short in the direction the price takes after a stable level ends
🔔 SMART ALERTS
Get notified at the most critical times by settings just one alert. Simply select CC Lite and Any alert() function call as the conditions when creating an alert and you will be tipped-off on bar-close as follows:
R─ (resistance line is highlighted)
S─ (support line is highlighted)
For example, an alert such as CC Lite 6h R─ would mean that during the last 6-hour bar the resistance line has been highlighted. The highlight lasts at least 15 bars from the first highlight bar regardless of price action.
Most Power V5 Most Power V5
The MOST indicator is an indicator used as a Moving Stoploss. The MOST indicator also generates a buy signal in case the prices rise, unlike the traditional indicators that allow you to make stop losses.In the MOST POWER V5 indicator, stoploss generates its signals using moving averages such as 'SMA', 'EMA', 'WMA', 'VWMA', 'HMA', 'SMMA', 'DEMA' rather than just the current price. In this way, it aims to prevent false signals that may be produced by excessive price movements during the day.
MOST POWER Indicator follows the average by preserving the stop loss distance in the movement of the moving average in the same direction.
The second variable that creates the MOST POWER curve is the stop loss distance that gives power to MOST with the moving average used and the shift rate that provides the stop signal. In this version, this distance is prepared with 2 separate inputs for both buy and sell.You can set these values as "percentage for long trend" and "percentage for short trend" in the indicator input properties.
You can also enter your Take Profit-1, Take Profit-2-, Take Profit-3- and Stop Loss levels in the indicator input properties, especially if you are interested in algo trading or to take advantage of the wonderful alarm setup features of tradingview and get the chance to get maximum profit. (If you enter Take Profit-1, Take Profit-2-, Take Profit-3- and Stop Loss levels as 0. Only buy and sell labels will appear on the indicator.)
Also, activate the amplitude filter option from the indicator input settings to get less signal and filter our inputs.
In addition, the entry price, take profit1, take profit2, take profit3 values for the last transaction opened to make things easier are located in the upper right corner of your graph as a table.
Important note: No indicator guarantees investment. That's why the tests you will do before real trades are very important in this indicator. I wish you all successful trades.
i will show how works with examples
Example 1
If you enter Take Profit-1, Take Profit-2-, Take Profit-3- and Stop Loss levels greater than 0
Example 2
If you enter Take Profit-1, Take Profit-2-, Take Profit-3- and Stop Loss levels as 0 (u will see only buy - sell labels)
Example 3
if select Amplitude Filter is on . you will see less signal
how works Amplitude Filter whats logic ?
if Amplitude Filter is active the signal from mostpower will be combined with Amplitude Filter.
for example, if the amplitude value is 2, the highest price and the lowest price of the last 2 bars are calculated. then this amplitude value is calculated for sma with its source high and low. Based on these values, the trend is determined in the amplitude of the price movement.
Important note: No indicator guarantees investment. That's why the tests you will do before real trades are very important in this indicator. I wish you all successful trades.

dmn's ICT ToolkitThis is my quality of life indicator for forex trading using the methods and concepts of ICT.
The idea is to automate marking up important price levels and times of the day instead of doing it manually every day.
Killzones
Marks the most volatile times of the day on the chart, during which the intraday high/low usually takes place.
Particularly impactful when there's news released during these times.
London Open (02:00-05:00 EST)
New York Open (08:30-11:00 EST)
London Close (10:00-11:30 EST)
True Day delineation
Vertical line at the start of the "true day" (00:00 EST), start of the algorithmic trading day and aids in visualizing the intraday direction.
New York midnight price level
Noteworthy price level at the start of the "true day".
This price level is referenced by the interbank trading algorithms during the day. Buy below it on bullish days, sell above it on bearish days.
Daily open price level
Reference level for optimal trade entries. Buy below it on bullish days, sell above it on bearish days.
Central Banks Dealers Range (CBDR) (14:00-20:00 EST) &
Central Banks Dealers Flout (CBDF) (15:00-24:00 EST) &
Asian Range (AR) (20:00-24:00 EST)
The standard deviation lines available are used to make predictions for short-term future highs/lows when the CBDR and AR are smaller than 40 pips.
Trade them by looking for 5/15min key levels that converge with the projection levels.
X days Average Daily Range (ADR)
Default to 5 days back, gives an idea of how much movement to expect intraday when the ADR high/low is converging with CBDR/CBDF/AR standard deviations.
Current Daily Range (CDR)
Used for comparison against the ADR to help determine if there's enough intraday range left to enter a trade.
Dynamically changes color based on percentage of the ADR. Green below 50% of ADR, orange between 50 and 100%, red when CDR exceeds ADR.
All of the above are used in conjunction with each other and higher timeframe levels of importance to find entries and target.
Note: Preferably use New York's time zone for your charts.

Investing ZonesInvesting Zones indicator shows the areas where LONGS or SHORTS can be made, the areas are calculated based on the mathematical averages of the high and low peaks of the price.
-There is an area called "No trading Zone" where the price is too slow, It also has a Alma Trend Ribbon (blue for uptrend, pink for downtrend) that helps to make trading decisions.
-You can make shorts when the price enters the Yellow zone called the "Sell Zone" and the price is below the Alma trend, set the TP1 in the white dotted line, and TP2 in the white lower line
-You can make longs when the price enters the Green zone called the "Buy Zone" and the price is above the Alma trend, set the TP1 in the yellow dotted line, and TP2 in the yellow upper line
-It works in all timeframes, personally I use it in 1min, 5min and 1hr.

Day Trading Booster by DGTTiming when day trading can be everything
In Stock markets typically more volatility (or price activity) occurs at market opening and closings
When it comes to Forex (foreign exchange market), the world’s most traded market, unlike other financial markets, there is no centralized marketplace, currencies trade over the counter in whatever market is open at that time, where time becomes of more importance and key to get better trading opportunities. There are four major forex trading sessions, which are Sydney , Tokyo , London and New York sessions
Forex market is traded 24 hours a day, 5 days a week across by banks, institutions and individual traders worldwide, but that doesn’t mean it’s always active the entire day. It may be very difficult time trying to make money when the market doesn’t move at all. The busiest times with highest trading volume occurs during the overlap of the London and New York trading sessions, because U.S. dollar (USD) and the Euro (EUR) are the two most popular currencies traded. Typically most of the trading activity for a specific currency pair will occur when the trading sessions of the individual currencies overlap. For example, Australian Dollar (AUD) and Japanese Yen (JPY) will experience a higher trading volume when both Sydney and Tokyo sessions are open
There is one influence that impacts Forex matkets and should not be forgotten : the release of the significant news and reports. When a major announcement is made regarding economic data, currency can lose or gain value within a matter of seconds
Cryptocurrency markets on the other hand remain open 24/7, even during public holidays
Until 2021, the Asian impact was so significant in Cryptocurrency markets but recent reasearch reports shows that those patterns have changed and the correlation with the U.S. trading hours is becoming a clear evolving trend.
Unlike any other market Crypto doesn’t rest on weekends, there’s a drop-off in participation and yet algorithmic trading bots and market makers (or liquidity providers) can create a high volume of activity. Never trust the weekend’ is a good thing to remind yourself
One more factor that needs to be taken into accout is Blockchain transaction fees, which are responsive to network congestion and can change dramatically from one hour to the next
In general, Cryptocurrency markets are highly volatile, which means that the price of a coin can change dramatically over a short time period in either direction
The Bottom Line
The more traders trading, the higher the trading volume, and the more active the market. The more active the market, the higher the liquidity (availability of counterparties at any given time to exit or enter a trade), hence the tighter the spreads (the difference between ask and bid price) and the less slippage (the difference between the expected fill price and the actual fill price) - in a nutshell, yield to many good trading opportunities and better order execution (a process of filling the requested buy or sell order)
The best time to trade is when the market is the most active and therefore has the largest trading volume, trading all day long will not only deplete a trader's reserves quickly, but it can burn out even the most persistent trader. Knowing when the markets are more active will give traders peace of mind, that opportunities are not slipping away when they take their eyes off the markets or need to get a few hours of sleep
What does the Day Trading Booster do?
Day Trading Booster is designed ;
- to assist in determining market peak times, the times where better trading opportunities may arise
- to assist in determining the probable trading opportunities
- to help traders create their own strategies. An example strategy of when to trade or not is presented below
For Forex markets specifically includes
- Opening channel of Asian session, Europien session or both
- Opening price, opening range (5m or 15m) and day (session) range of the major trading center sessions, including Frankfurt
- A tabular view of the major forex markets oppening/closing hours, with a countdown timer
- A graphical presentation of typically traded volume and various forext markets oppening/clossing events (not only the major markets but many other around the world)
For All type of markets Day Trading Booster plots
- Day (Session) Open, 5m, 15m or 1h Opening Range
- Day (Session) Referance Levels, based on Average True Range (ATR) or Previous Day (Session) Range (PH - PL)
- Week and Month Open
Day Trading Booster also includes some of the day trader's preffered indicaotrs, such as ;
- VWAP - A custom interpretaion of VWAP is presented here with Auto, Interactive and Manual anchoring options.
- Pivot High/Low detection - Another custom interpretation of Pivot Points High Low indicator.
- A Moving Average with option to choose among SMA, EMA, WMA and HMA
An example strategy - Channel Bearkout Strategy
When day trading a trader usually monitors/analyzes lower timeframe charts and from time to time may loose insight of what really happens on the market from higher time porspective. Do not to forget to look at the larger time frame (than the one chosen to trade with) which gives the bigger picture of market price movements and thus helps to clearly define the trend
Disclaimer : Trading success is all about following your trading strategy and the indicators should fit within your trading strategy, and not to be traded upon solely
The script is for informational and educational purposes only. Use of the script does not constitutes professional and/or financial advice. You alone the sole responsibility of evaluating the script output and risks associated with the use of the script. In exchange for using the script, you agree not to hold dgtrd TradingView user liable for any possible claim for damages arising from any decision you make based on use of the script

Price Average ZonesThis indicator shows the areas where LONGS or SHORTS can be made, the areas are calculated based on the mathematical averages of the high and low peaks of the price.
It also has a line that shows the average of the price movement. you can make shorts when the price enters the orange zone called the "Short Zone".
You can make longs when the price enters the orange zone called the sell zone.
It works in all timeframes, personally I use it in 1 min and in 1 hour.

FluidTrades - SMC Lite
Price action and supply and demand is a key strategy use in trading. We wanted it to be easy and efficient for user to identify these zones, so the user can focus less on marking up charts and focus more on executing trades.
This indicator shows you supply and demand zones by using pivot points to show you the recent highs and the recent lows.
Features
This indicator includes some features relevant to SMC , these are highlighted below:
Full internal & swing market structure labeling in real-time
Swing Structure: Displays the swing structure labels & solid lines on the chart (BOS).
Supply & demand ( bullish & bearish )
Swing Points: Displays swing points labels on chart such as HH, HL, LH, LL.
Options to style the indicator to more easily display these concepts
White OB (supply): search for short opportunities
Blue OB (demand): search for long opportunities
Break of structure ( BOS )
For markets to move up and down a break in market structure must occur. A break in market structure occurs when the market begins to shift direction and break the previous HH and HL or HL and LL of the market. We also integrated the feature that you can see the BOS lines. In the indicator settings you can adjust the color of the label.
Settings
SwingHigh/Low Length: Allows the user to select Historical (default) or Present, which displays only recent data on the chart.
Supply/demand box width: Allows user to change the size of the supply and demand box
History to keep: allows the user to select how many most recent supply & demand box appear on the chart.
Visual settings
Show zig zag : allow user to see market patters within the market
Show price action labels: allow user to turn on/off the (swing points)
Supply box color : allow users to change the color of their supply box
Demand box color : allow users to change the color of their supply box
Bos label color : allow users to change the color of their BOS label
Poi label color : allow user to change the color of their POI label
Price action label : allow users to change the color of their swing points labels
Zig zag color : allow users to change the color of the zig/zag market patters
Warning
Never blindly take a trade on a supply/demand box - wait for a proper market structure to occur before considering a trade.
